. 2012;7(7):e41175.
doi: 10.1371/journal.pone.0041175. Epub 2012 Jul 31.

The natural history of class I primate alcohol dehydrogenases includes gene duplication, gene loss, and gene conversion

Affiliations

The natural history of class I primate alcohol dehydrogenases includes gene duplication, gene loss, and gene conversion

Matthew A Carrigan et al. PLoS One. 2012.

Abstract

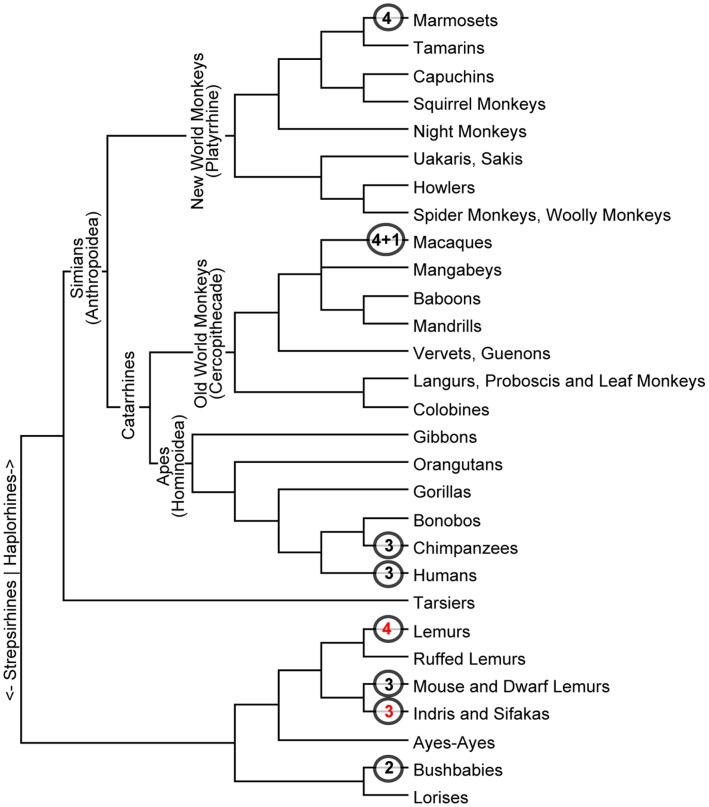
Background: Gene duplication is a source of molecular innovation throughout evolution. However, even with massive amounts of genome sequence data, correlating gene duplication with speciation and other events in natural history can be difficult. This is especially true in its most interesting cases, where rapid and multiple duplications are likely to reflect adaptation to rapidly changing environments and life styles. This may be so for Class I of alcohol dehydrogenases (ADH1s), where multiple duplications occurred in primate lineages in Old and New World monkeys (OWMs and NWMs) and hominoids.

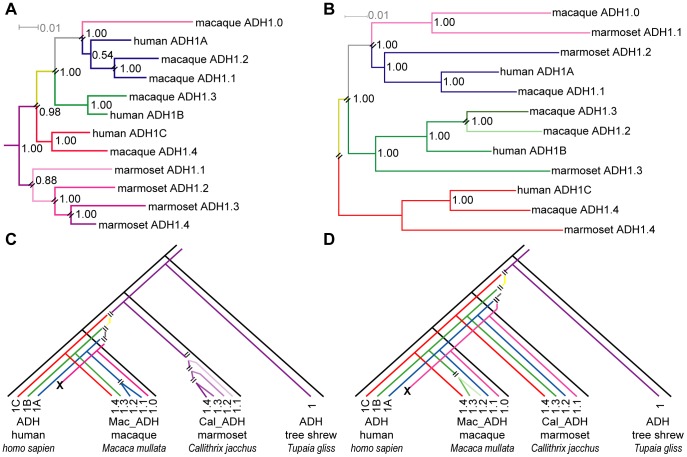
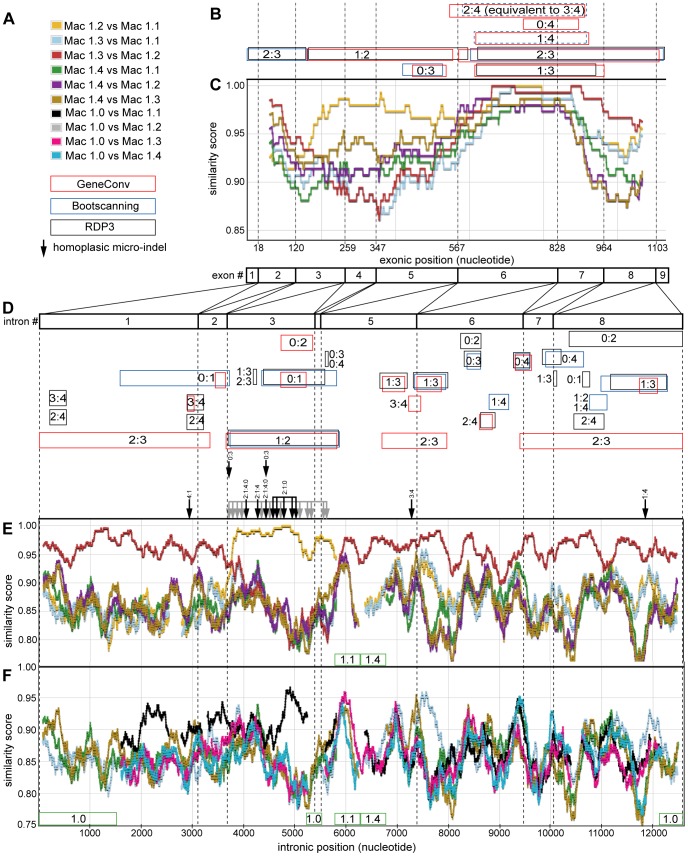
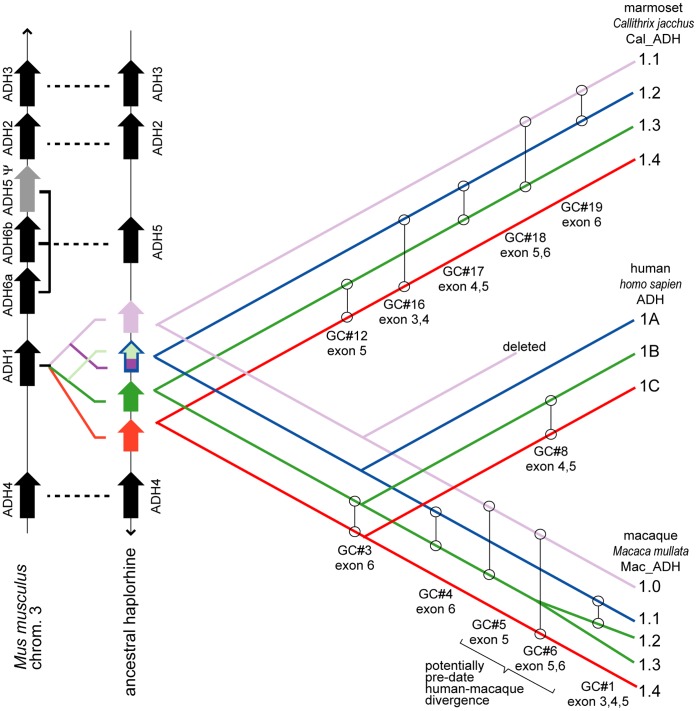
Methodology/principal findings: To build a preferred model for the natural history of ADH1s, we determined the sequences of nine new ADH1 genes, finding for the first time multiple paralogs in various prosimians (lemurs, strepsirhines). Database mining then identified novel ADH1 paralogs in both macaque (an OWM) and marmoset (a NWM). These were used with the previously identified human paralogs to resolve controversies relating to dates of duplication and gene conversion in the ADH1 family. Central to these controversies are differences in the topologies of trees generated from exonic (coding) sequences and intronic sequences.

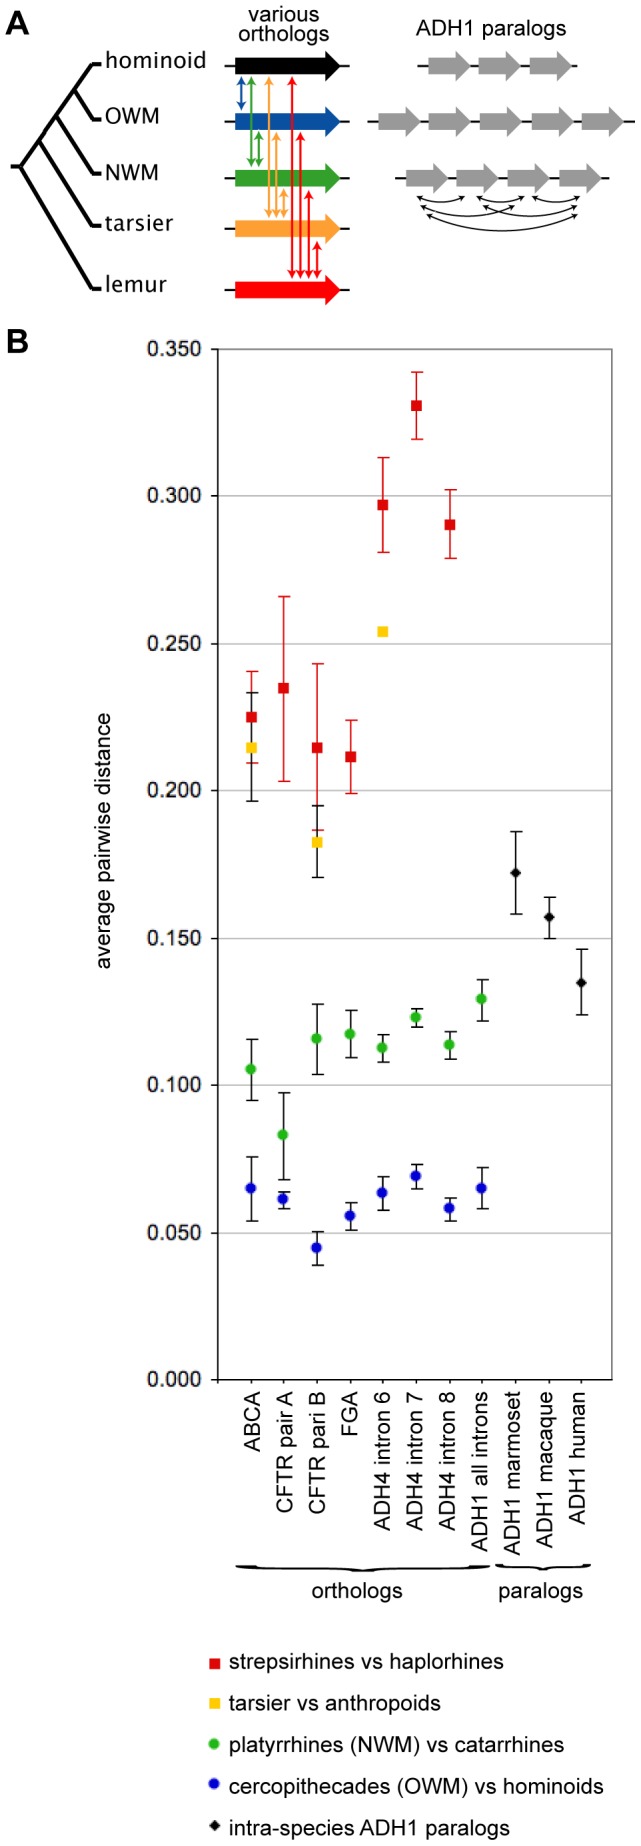
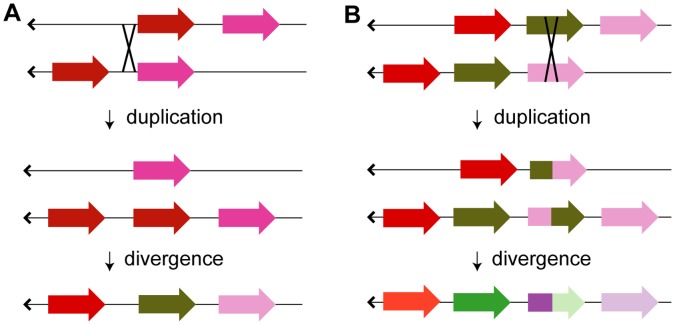
Conclusions/significance: We provide evidence that gene conversions are the primary source of difference, using molecular clock dating of duplications and analyses of microinsertions and deletions (micro-indels). The tree topology inferred from intron sequences appear to more correctly represent the natural history of ADH1s, with the ADH1 paralogs in platyrrhines (NWMs) and catarrhines (OWMs and hominoids) having arisen by duplications shortly predating the divergence of OWMs and NWMs. We also conclude that paralogs in lemurs arose independently. Finally, we identify errors in database interpretation as the source of controversies concerning gene conversion. These analyses provide a model for the natural history of ADH1s that posits four ADH1 paralogs in the ancestor of Catarrhine and Platyrrhine primates, followed by the loss of an ADH1 paralog in the human lineage.


Conflict of interest statement

Competing Interests: The authors have declared that no competing interests exist.

Figures

Figure 1
Figure 1. Overview of primate phylogeny.
An overview of primate phylogeny is shown, with the number of ADH1 paralogs identified within select taxon indicated by the circled numbers at the leaves of the tree. Black numbers are derived from analysis of public databases, while red numbers were determined from cDNA sequencing reported here. The “4+1” designation for the macaque taxon indicates the presence of four ADH1 paralogous genes plus one ADH1 pseudogene. The genome sequencing projects are not completed for any lemur, so additional ADH1 paralogs may be present (see text).
Figure 2
Figure 2. Phylogeny of primate ADH1 paralogs.
Phylogeny of primate ADH1 paralogs inferred from (A) exonic sequence data (“exonic tree”) and (B) intronic data (“intronic tree”). Parallel black lines indicate bifurcations associated with gene duplications without speciation. ADH1 genes from New World monkeys (represented by marmoset) form a separate clade from the hominid/OWM genes in the exonic tree (A), while they interleave with hominid/OWM genes in the intronic tree (B). The lower panels, (C) and (D), redraw the gene tree from (A) and (B) in a species tree format, highlighting where each gene duplication occurs relative to the divergence of each primate lineage. The exonic tree is rooted using multiple non-primate ADH1 genes (see Figure S2). The intronic tree is unrooted (due to ambiguity, see text). The names of ADH1 paralogs have been shortened (e.g. the marmoset (Callthrix jacchus) ADH1 paralog “Cal_ADH1.1” is simply referred to as “marmoset ADH1.1”). Numbers at nodes refer to the Bayesian posterior probability values.
Figure 3
Figure 3. Estimate of the ADH1 paralog duplications relative to the time of the major primate speciation events.
The average pairwise distances separating the introns of the ADH1 paralogs were compared with the average pairwise distances separating a set of introns in paired taxa. (A) This schematic illustrates the various ortholog comparisons used to estimate the relative age among the ADH1 paralogs. (B) This plot summaries the data in Table 2 and 3. The distances among the ADH1 paralogs in marmoset, macaque and human (black diamonds) are somewhat larger than those separating catarrhine and platyrrhine orthologs (green circles), implying that these ADH1 paralogs diverged (duplicated) before the catarrhine-platyrrhine split. Conversely, distances separating the ADH1 paralogs in marmoset, macaque and human are somewhat smaller than those separating orthologous introns among strepsirhine and haplorhine (red squares), implying that these ADH1 paralogs diverged after the split between strepsirhine and haplorhine.
Figure 4
Figure 4. Gene duplication can generate “whole gene” and “chimeric gene” paralogs.
(a) When unequal crossing-over (denoted with an “X”) occurs within the intergenic region between two paralogs, one chromosome gains an extra copy of a paralog, while the other chromosome loses one of the paralogs. This is followed by divergence of each paralog (only shown for the chromosome that gained a paralog and denoted as shift in color). A similar process can lead to the creation of the original paralog duplication, if, for example, transposons generate regions of sequence similarity on either side of a gene, thus enabling unequal crossing-over (not shown). (b) The same process can also lead to a chimeric gene duplicate if the crossing over occurs within the intragenic region (most likely within an intronic region).
Figure 5
Figure 5. Summary of gene conversion analysis for macaque ADH1 paralogs.
Exonic and intronic data sets were examined for indicators of gene conversion using similarity plots, homoplasic micro-indels, and various computational methods. (A) The figure legend displays the color schemes used in subsequent panels for illustrating pairwise similarity scores among paralogs, and the key used to summarize the results from various methods used to identify potential gene conversions. The names of ADH1 paralogs have been shortened (e.g. the macaque (Macaca mullata) ADH1 paralog “Mac_ADH1.1” is simply referred to as “Mac 1.1”). Pairwise similarity within a sliding window is plotted for various paralogs within (C) exonic regions (Mac_ADH1.0 is not included), (E) intronic regions (without Mac_ADH1.0, the pseudogene), and (F) intronic regions including Mac_ADH1.0. The color of the line in the similarity plot corresponds to the identity of the paralog pair, as indicated in the figure legend (A). Similarity scores for exonic regions are calculated within a 150-nt sliding window, while that of intronic regions are calculated using a 250-nt sliding window. Colored boxes in (B) and (D) indicate putative gene conversion events identified by various computation methods. The color of the box corresponds to the computational method identifying each potential gene conversion, as indicated in the figure legend (A). Boxes with dashed borders indicate gene conversions that were not statistically significant at p-values <0.05, but were identified using p-values <0.10. The paralogs implicated in gene conversion are indicated within (or adjacent to) the colored box using the paralog suffix (e.g a gene conversion between Mac_ADH1.1 and Mac_ADH1.2 is indicated by “1∶2”). Homoplasic micro-indels in the intronic sequences are shown as vertical black arrows with the paralogs sharing these micro-indels indicated above each each arrow (the many homoplasic micro-indels shared by Mac_ADH1.1 and Mac_ADH1.2 are simply indicated with grey arrows). Boundaries between introns or exons are demarcated with dotted vertical lines. Green boxes below the similarity plots indicate large gaps in the alignment, with the affected paralog indicated within the box.
Figure 6
Figure 6. Model of ADH1 paralog duplication and subsequent evolution in haplorhines.
Thin vertical black arrows indicate the direction of the chromosome while thick vertical arrows identify ADH genes in the direction of transcription, with ADH1 paralogs in primates colored according to the intronic phylogeny in Fig. 2B. Dashed lines connect orthologs. Diagonal lines indicate the proposed phylogeny of haplorrhine ADH1 paralogs. The root of the haplorhine ADH1 tree is not specified because the duplication order of haplorhine ADH1 paralogs is ambiguous (see text). Putative gene conversions are indicated with open circles connected by vertical lines (from Table 4).

References

    1. Gaucher EA, Graddy LG, Simmen RCM, Simmen FA, Liberles DA, et al. (2004) The planetary biology of cytochrome P450 aromatase from swine. BMC Biology 2: Art.19. - PMC - PubMed
    1. Bailey JA, Eichler EE (2006) Primate segmental duplications: crucibles of evolution, diversity and disease. Nature Reviews Genetics 7: 552–564. - PubMed
    1. Chang M, Benner SA (2004) Empirical analysis of insertions and deletions in protein sequence evolution. J Mol Biol 341: 617–631. - PubMed
    1. Fukami-Kobayashi K, Schreiber DR, Benner SA (2002) Detecting compensatory covariation signals in protein evolution using reconstructed ancestral sequences. J Mol Biol 319: 729–743. - PubMed
    1. Sassi SO, Braun EL, Benner SA (2007) The evolution of seminal ribonuclease. Pseudogene reactivation or multiple gene inactivation events? Mol Biol Evol 24: 1012–1024. - PubMed

Publication types

Substances