Gamma activation in young people with autism spectrum disorders and typically-developing controls when viewing emotions on faces
- PMID: 22859975
- PMCID: PMC3409185
- DOI: 10.1371/journal.pone.0041326
Gamma activation in young people with autism spectrum disorders and typically-developing controls when viewing emotions on faces
Abstract
Background: Behavioural studies have highlighted irregularities in recognition of facial affect in children and young people with autism spectrum disorders (ASDs). Recent findings from studies utilising electroencephalography (EEG) and magnetoencephalography (MEG) have identified abnormal activation and irregular maintenance of gamma (>30 Hz) range oscillations when ASD individuals attempt basic visual and auditory tasks.
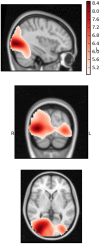
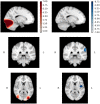
Methodology/principal findings: The pilot study reported here is the first study to use spatial filtering techniques in MEG to explore face processing in children with ASD. We set out to examine theoretical suggestions that gamma activation underlying face processing may be different in a group of children and young people with ASD (n = 13) compared to typically developing (TD) age, gender and IQ matched controls. Beamforming and virtual electrode techniques were used to assess spatially localised induced and evoked activity. While lower-band (3-30 Hz) responses to faces were similar between groups, the ASD gamma response in occipital areas was observed to be largely absent when viewing emotions on faces. Virtual electrode analysis indicated the presence of intact evoked responses but abnormal induced activity in ASD participants.
Conclusions/significance: These findings lend weight to previous suggestions that specific components of the early visual response to emotional faces is abnormal in ASD. Elucidation of the nature and specificity of these findings is worthy of further research.
Conflict of interest statement
Figures


Similar articles
-
Frontal evoked γ activity modulates behavioural performance in Autism Spectrum Disorders in a perceptual simultaneity task.Neurosci Lett. 2018 Feb 5;665:86-91. doi: 10.1016/j.neulet.2017.11.045. Epub 2017 Nov 27. Neurosci Lett. 2018. PMID: 29191694 Free PMC article.
-
Impaired gamma-band activity during perceptual organization in adults with autism spectrum disorders: evidence for dysfunctional network activity in frontal-posterior cortices.J Neurosci. 2012 Jul 11;32(28):9563-73. doi: 10.1523/JNEUROSCI.1073-12.2012. J Neurosci. 2012. PMID: 22787042 Free PMC article.
-
Neural circuitry of emotional face processing in autism spectrum disorders.J Psychiatry Neurosci. 2010 Mar;35(2):105-14. doi: 10.1503/jpn.090085. J Psychiatry Neurosci. 2010. PMID: 20184808 Free PMC article.
-
Early neural activation during facial affect processing in adolescents with Autism Spectrum Disorder.Neuroimage Clin. 2014 Nov 18;7:203-12. doi: 10.1016/j.nicl.2014.11.009. eCollection 2015. Neuroimage Clin. 2014. PMID: 25610782 Free PMC article.
-
Research review: Constraining heterogeneity: the social brain and its development in autism spectrum disorder.J Child Psychol Psychiatry. 2011 Jun;52(6):631-44. doi: 10.1111/j.1469-7610.2010.02349.x. Epub 2011 Jan 19. J Child Psychol Psychiatry. 2011. PMID: 21244421 Free PMC article. Review.
Cited by
-
Altered modulation of gamma oscillation frequency by speed of visual motion in children with autism spectrum disorders.J Neurodev Disord. 2015;7(1):21. doi: 10.1186/s11689-015-9121-x. Epub 2015 Aug 10. J Neurodev Disord. 2015. PMID: 26261460 Free PMC article.
-
Leveraging AI-Driven Neuroimaging Biomarkers for Early Detection and Social Function Prediction in Autism Spectrum Disorders: A Systematic Review.Healthcare (Basel). 2025 Jul 22;13(15):1776. doi: 10.3390/healthcare13151776. Healthcare (Basel). 2025. PMID: 40805809 Free PMC article. Review.
-
Autism Spectrum Disorder (ASD) and Fragile X Syndrome (FXS): Two Overlapping Disorders Reviewed through Electroencephalography-What Can be Interpreted from the Available Information?Brain Sci. 2015 Mar 27;5(2):92-117. doi: 10.3390/brainsci5020092. Brain Sci. 2015. PMID: 25826237 Free PMC article. Review.
-
Sensory processing in autism spectrum disorders and Fragile X syndrome-From the clinic to animal models.Neurosci Biobehav Rev. 2017 May;76(Pt B):235-253. doi: 10.1016/j.neubiorev.2016.05.029. Epub 2016 May 24. Neurosci Biobehav Rev. 2017. PMID: 27235081 Free PMC article. Review.
-
Very preterm brain at rest: longitudinal social-cognitive network connectivity during childhood.Soc Cogn Affect Neurosci. 2022 Apr 1;17(4):377-386. doi: 10.1093/scan/nsab110. Soc Cogn Affect Neurosci. 2022. PMID: 34654932 Free PMC article.
References
-
- World Health Organisation (1993) The ICD –10 Classification of Mental and Behavioural Disorders:- Diagnostic Criteria for Research: General World Health Organisation.
-
- Weeks S, Hobson RP (1987) The salience of facial expression for autistic children. Journal of Child Psychology and Psychiatry 28 (1): 137–151. - PubMed
-
- Dawson G, Webb SJ, McPartland J (2005) Understanding the nature of face processing impairment in autism: insights from behavioral and electrophysiological studies. Developmental Neuropsychology 27 (3): 403–424. - PubMed
-
- Harms M, Martin A, Wallace G (2010) Facial emotion recognition in autism spectrum disorders: a review of behavioral and neuroimaging studies. Neuropsychology Review 20: 290–322. - PubMed
-
- Jemel B, Mottron L, Dawson M (2006) Impaired face processing in autism: Fact or artifact? Journal of Autism and Developmental Disorders 36: 91–106. - PubMed
MeSH terms
LinkOut - more resources
Full Text Sources

