. 2012;7(7):e41506.
doi: 10.1371/journal.pone.0041506. Epub 2012 Jul 31.

Neuronal transcription factors induce conversion of human glioma cells to neurons and inhibit tumorigenesis

Affiliations

Neuronal transcription factors induce conversion of human glioma cells to neurons and inhibit tumorigenesis

Junli Zhao et al. PLoS One. 2012.

Abstract

Recent findings have demonstrated that the overexpression of lineage-specific transcription factors induces cell fate changes among diverse cell types. For example, neurons can be generated from mouse and human fibroblasts. It is well known that neurons are terminally differentiated cells that do not divide. Therefore, we consider how to induce glioma cells to become neurons by introducing transcription factors. Here, we describe the efficient generation of induced neuronal (iN) cells from glioma cells by the infection with three transcription factors: Ascl1, Brn2 and Ngn2 (ABN). iN cells expressed multiple neuronal markers and fired action potentials, similar to the properties of authentic neurons. Importantly, the proliferation of glioma cells following ABN overexpression was dramatically inhibited in both in vitro and in vivo experiments. In addition, iN cells that originated from human glioma cells did not continue to grow when they were sorted and cultured in vitro. The strategies by which glioma cells are induced to become neurons may be used to clinically study methods for inhibiting tumor growth.


Conflict of interest statement

Competing Interests: The authors have declared that no competing interests exist.

Figures

Figure 1
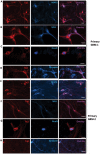
Figure 1. Induction of human glioma cells to neurons.
A,B, Thirteen days after infection with Asc1, Brn2 and Ngn2, primary human glioma cells (GBM-1, -2) expressed neuronal protein Tuj1 and displayed a neuronal morphology. iN cell generation efficiencies estimated from Tuj1-positive cells. C, Induction of U251 human glioma cells to neurons by overexpressing ABN. D, Induction of U87 human glioma cells to neurons by overexpressing ABN. E,F,G,H, Quantification of iN cells induced from primary GBM-1, GBM-2, U251 and U87 cells. Scale bars: 100 µm. Error bars indicate ±s.d.
Figure 2
Figure 2. Characterization of iN cells converted from human glioma cells.
A, GBM-1 primary human glioma cells were effectively induced to become neurons and expressed the neuronal proteins Tuj1 and MAP2 thirteen days after infection with ABN. B,C,D, iN cells expressed the mature neuronal proteins Neurofilament, NeuN and Synapsin three weeks after infection with ABN. E,F,G,H, GBM-2 primary human glioma cells expressed the neuronal proteins Tuj1, MAP2, Neurofilament, NeuN and Synapsin. Scale bars: 25 µm.
Figure 3
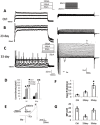
Figure 3. Physiological characterization of iN cells from primary human glioma cells.
A, Representative traces of action potentials (left) and voltage dependent membrane currents (right) in control glioma cells. B, Representative traces of action potentials (left) and voltage gated membrane currents (right) in iN cells at 23 days after infection. C, Representative traces of action potentials (left) and voltage gated membrane currents (right) in iN cells at 33 days after infection. D, Quantification of currents density of different groups (control, n = 4; iN, 23 days, n = 6, 33 days, n = 3). E, Representative traces of currents measured by ramp protocol. F,G, Quantification of the input resistant (control, n = 4; iN, 23 days, n = 6, 33 days, n = 3), and membrane potentials (control, n = 4; iN, 23 days, n = 6, 33 days, n = 3). *:p<0.05, **:p<0.01 vs control group. Error bars indicate ±s.d. Scale bars: 25 µm.
Figure 4
Figure 4. The ABN neuronal transcription factors inhibit glioma cell proliferation.
A, Primary glioma cells were counted 2, 3 or 4 days post-infection by ABN or control virus. Cell numbers were normalized to the number of cells plated at day 0. B, U251 cells were counted 2, 3 or 4 days post-infection by ABN or control virus. C, U87 cells were counted 2, 3 or 4 days post-infection by ABN or control virus. The data represent six independent experiments. D, Synpasin positive cells were isolated from synapsin-mcherry infected primary human glioma cells (GBM-1). Synapsin positive cells were sorted out and cultured for 1, 3, 5 or 7 days. Synapsin positive iN cells did not grow completely. *P<0.05. Data are presented as mean ±s.d.
Figure 5
Figure 5. ABN neuronal transcription factors inhibit glioma cells colony formation after long-term culturing and caused arrest of the cell cycle at G0/G1.
A, Primary glioma cells were infected with ABN and control virus. Three days after infection, cells were plated at a low density and cultured for 2 weeks. Colonies were visualized by crystal violet staining, and the density was measured by OD595. B, U251 cells were infected with ABN and control virus. C, U87 cells were infected with ABN and control virus. The data represent six independent experiments. D, Cell cycle distributions of primary glioma cells were analyzed three days after infection with ABN. Cells were incubated with propidium iodide at a final concentration of 10 g/ml. After incubation at room temperature for 1 h, cells were analyzed by FACS for cell cycle distribution. E, The U251 cell cycle distribution was detected and analyzed. F, The U87 cell cycle distribution was detected and analyzed. *P<0.05. Data are presented as mean ±s.d. Scale bars: 1 mm.
Figure 6
Figure 6. ABN neuronal transcription factors prolong mouse survival after intracranial glioma cell transplantation.
A, Nude mice were intracranially transplanted with 5×10⁵ glioma cells infected with ABN or control virus. Representative tumor images were obtained by MRI 1 or 3 weeks after glioma transplantation. B, Tumor size was quantified and analyzed. C, Brain sections were collected and performed by HE staining. D, Survival of nude mice (n  = 6 mice for each condition) was evaluated by Kaplan-Meier analysis. Mice bearing gliomas from ABN-treated glioma cells survived longer than those from control-treated cells. *P<0.05. Error bars indicate ±s.d. Scale bars: 2 mm (6A), 900 µm (6C).

References

    1. Dell’Albani P (2008) Stem cell markers in gliomas. Neurochem Res 33: 2407–2415. - PubMed
    1. Sukhdeo K, Hambardzumyan D, Rich JN (2011) Glioma development: where did it all go wrong? Cell 146: 187–188. - PubMed
    1. Behin A, Hoang-Xuan K, Carpentier AF, Delattre JY (2003) Primary brain tumours in adults. Lancet 361: 323–331. - PubMed
    1. Norden AD, Drappatz J, Wen PY (2009) Antiangiogenic therapies for high-grade glioma. Nat Rev Neurol 5: 610–620. - PubMed
    1. Hadziahmetovic M, Shirai K, Chakravarti A (2011) Recent advancements in multimodality treatment of gliomas. Future Oncol 7: 1169–1183. - PMC - PubMed

Publication types

MeSH terms