

Development of a charting method to monitor the individual performance of surgeons at the beginning of their career
- PMID: 22860036
- PMCID: PMC3409207
- DOI: 10.1371/journal.pone.0041944
Development of a charting method to monitor the individual performance of surgeons at the beginning of their career
Abstract
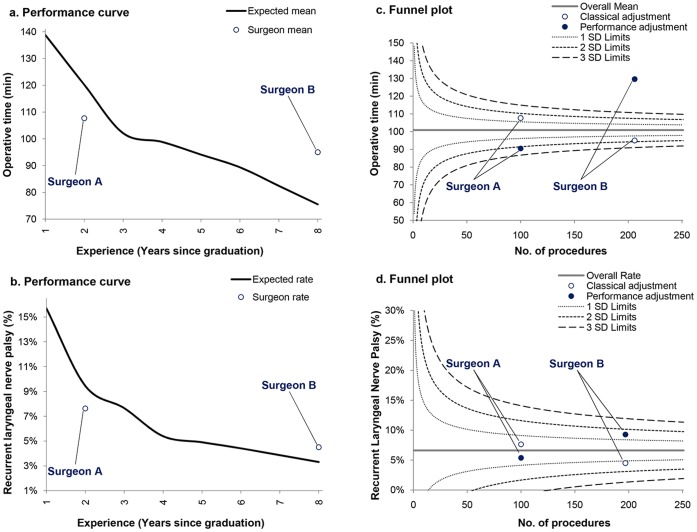
Background: Efforts to provide a valid picture of surgeons' individual performance evolution should frame their outcomes in relation to what is expected depending on their experience. We derived the learning curve of young thyroidectomy surgeons as a baseline to enable the accurate assessment of their individual outcomes and avoid erroneous conclusions that may derive from more traditional approaches.
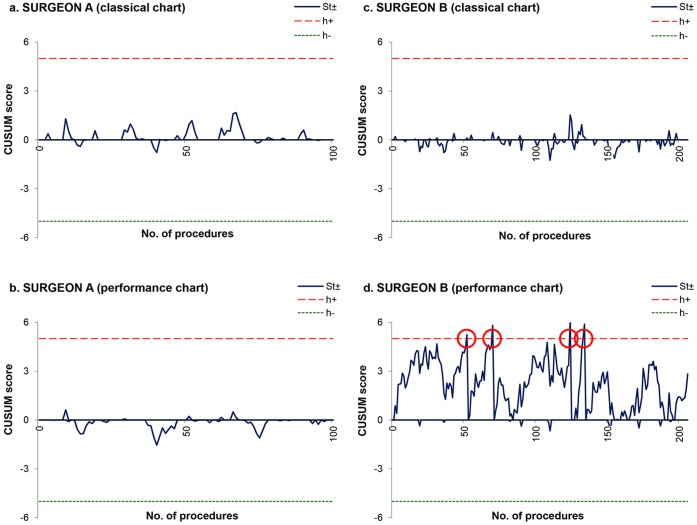
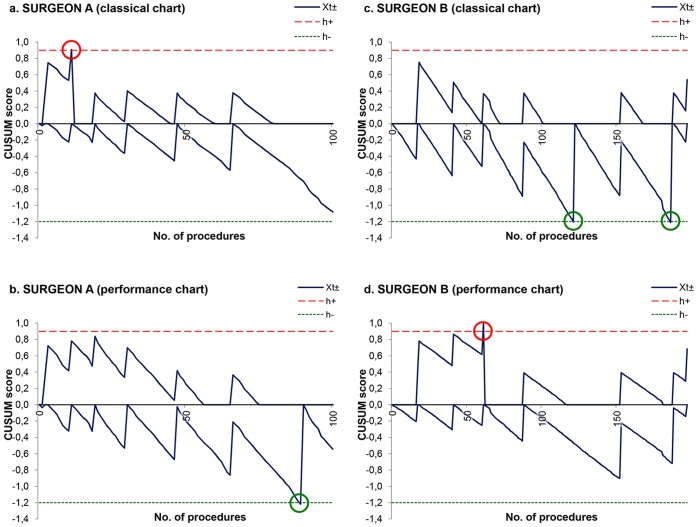
Methods: Operative time and postoperative recurrent laryngeal nerve palsy of 2006 patients who underwent a thyroidectomy performed by 19 young surgeons in five academic hospitals were monitored from April 2008 to December 2009. The database was randomly divided into training and testing datasets. The training data served to determine the expected performance curve of surgeons during their career and factors influencing outcome variation using generalized estimating equations (GEEs). To simulate prospective monitoring of individual surgeon outcomes, the testing data were plotted on funnel plots and cumulative sum charts (CUSUM). Performance charting methods were utilized to present outcomes adjusted both for patient case-mix and surgeon experience.
Results: Generation of performance curves demonstrated a gradual reduction in operative time from 139 (95% CI, 137 to 141) to 75 (71 to 80) minutes, and from 15.7% (15.1% to 16.3%) to 3.3% (3.0% to 3.6%) regarding the nerve palsy rate. Charts interpretation revealed that a very young surgeon had better outcomes than expected, whereas a more experienced surgeon appeared to be a poor performer given the number of years that he had already spent in practice.
Conclusions: Not considering the initial learning curve of surgeons exposes them to biased measurement and to misinterpretation in assessing their individual performance for thyroidectomy. The performance chart represents a valuable tool to monitor the outcome of surgeons with the expectation to provide safe and efficient care to patients.
Conflict of interest statement
Figures
References
-
- Ericsson KA (2008) Deliberate practice and acquisition of expert performance: a general overview. Acad Emerg Med 15(11): 988–994. - PubMed
-
- Ramsay CR, Grant AM, Wallace SA, Garthwaite PH, Monk AF, et al. (2001) Statistical assessment of the learning curves of health technologies. Health Technol Assess 5(12): 1–79. - PubMed
-
- Cook JA, Ramsay CR, Fayers P (2007) Using the literature to quantify the learning curve: a case study. Int J Technol Assess Health Care 23(2): 255–260. - PubMed
-
- Schmidt RA, Lee TD (2005) Motor control and learning: A behavioral emphasis. Champaign, IL: Human Kinetics.
-
- Gaster B (1993) A piece of my mind. The learning curve. JAMA 270(11): 1280. - PubMed
Publication types
MeSH terms
LinkOut - more resources
Full Text Sources
Molecular Biology Databases
Miscellaneous
