. 2012;7(7):e42279.
doi: 10.1371/journal.pone.0042279. Epub 2012 Jul 31.

Yeasts acquire resistance secondary to antifungal drug treatment by adaptive mutagenesis

Affiliations

Yeasts acquire resistance secondary to antifungal drug treatment by adaptive mutagenesis

David Quinto-Alemany et al. PLoS One. 2012.

Abstract

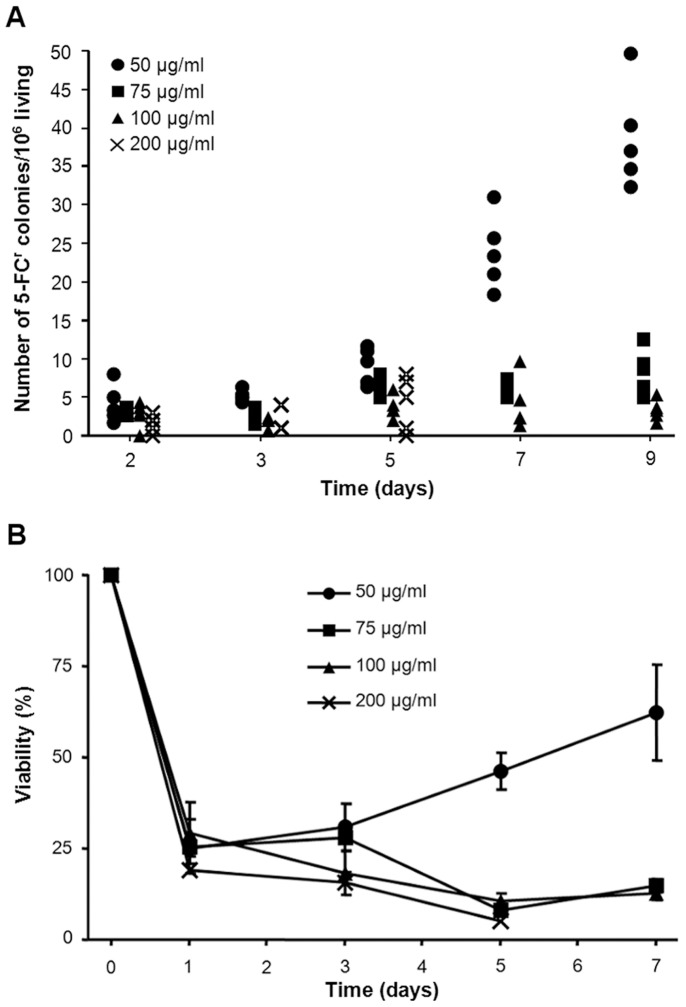
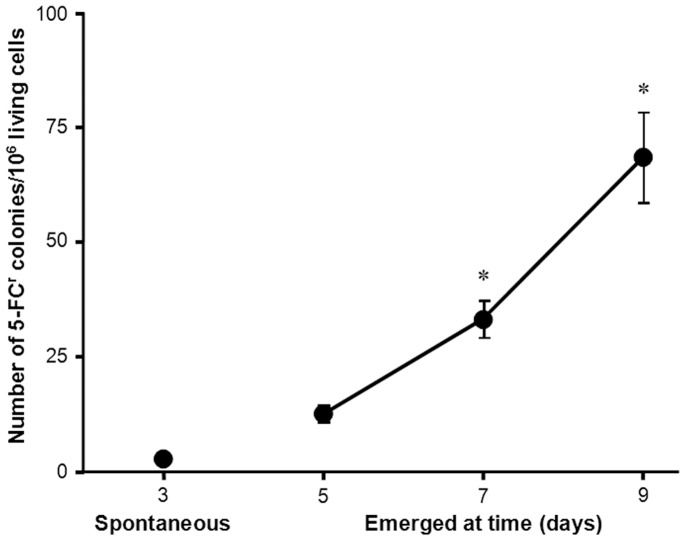
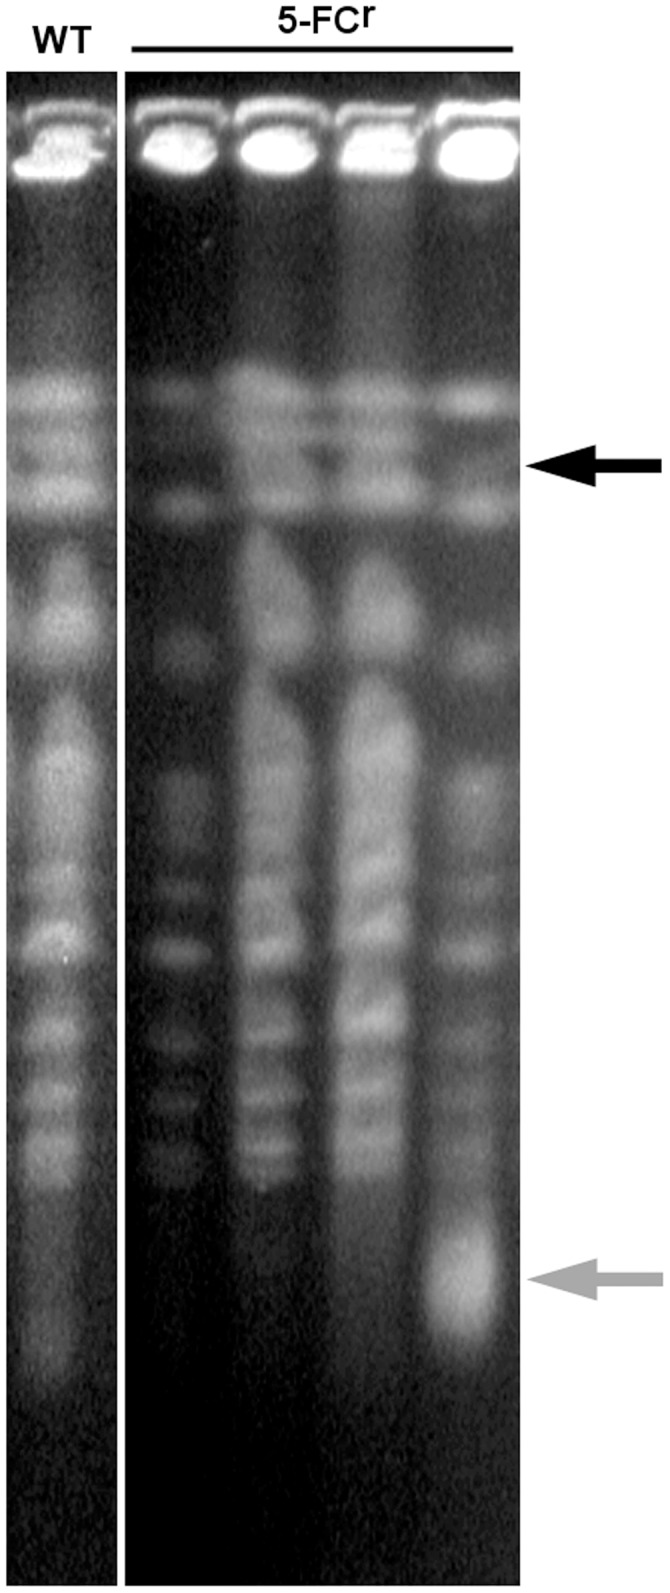
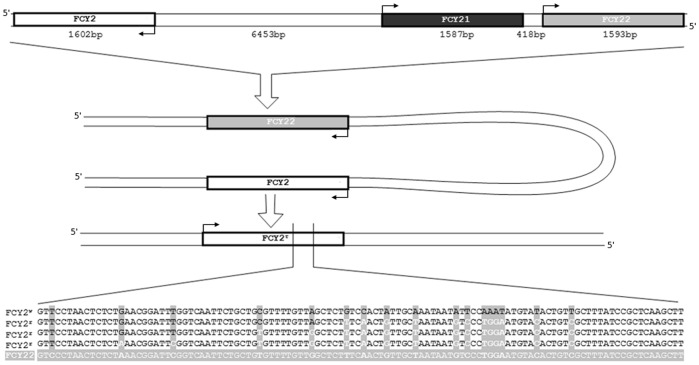
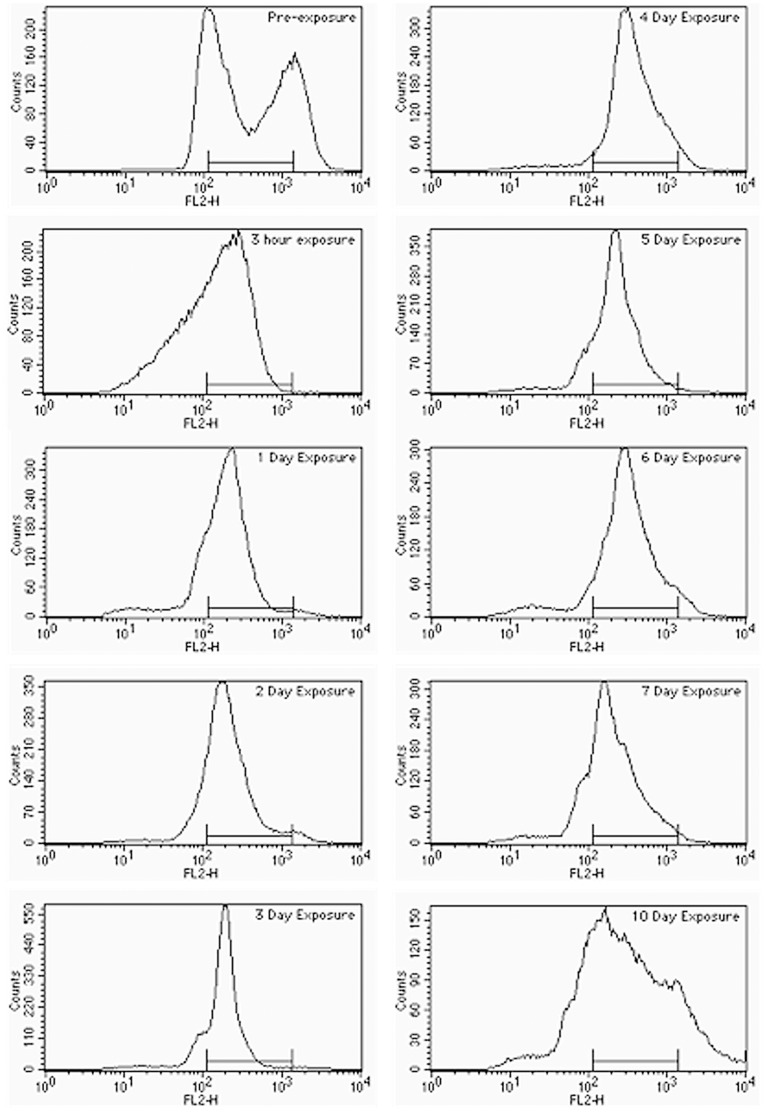
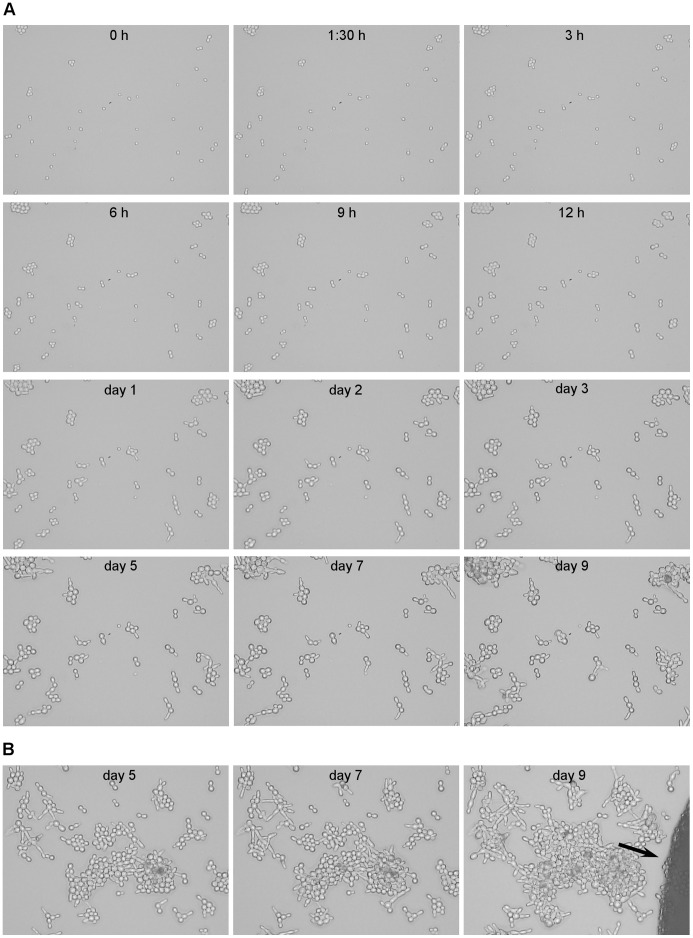
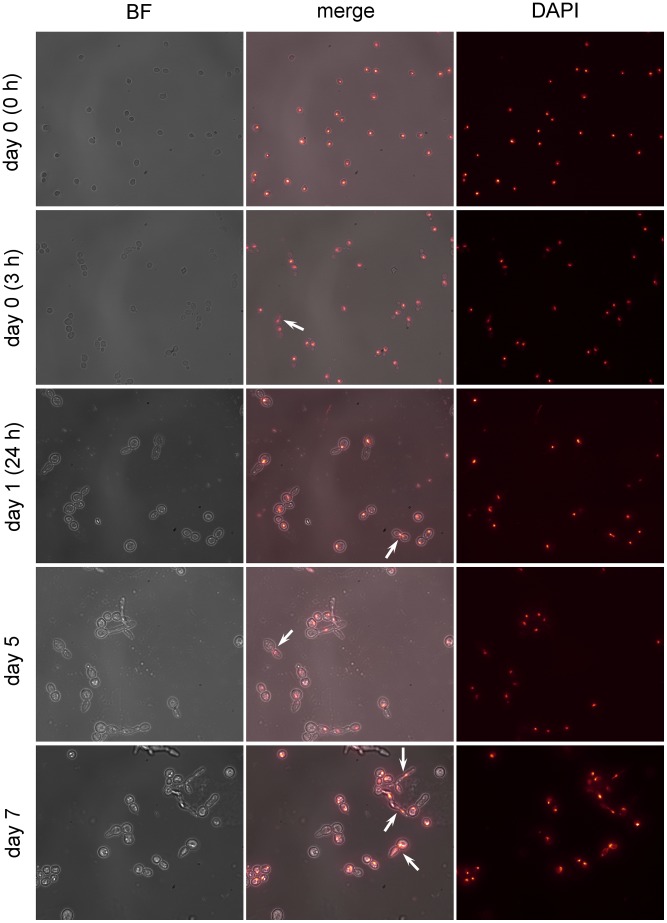
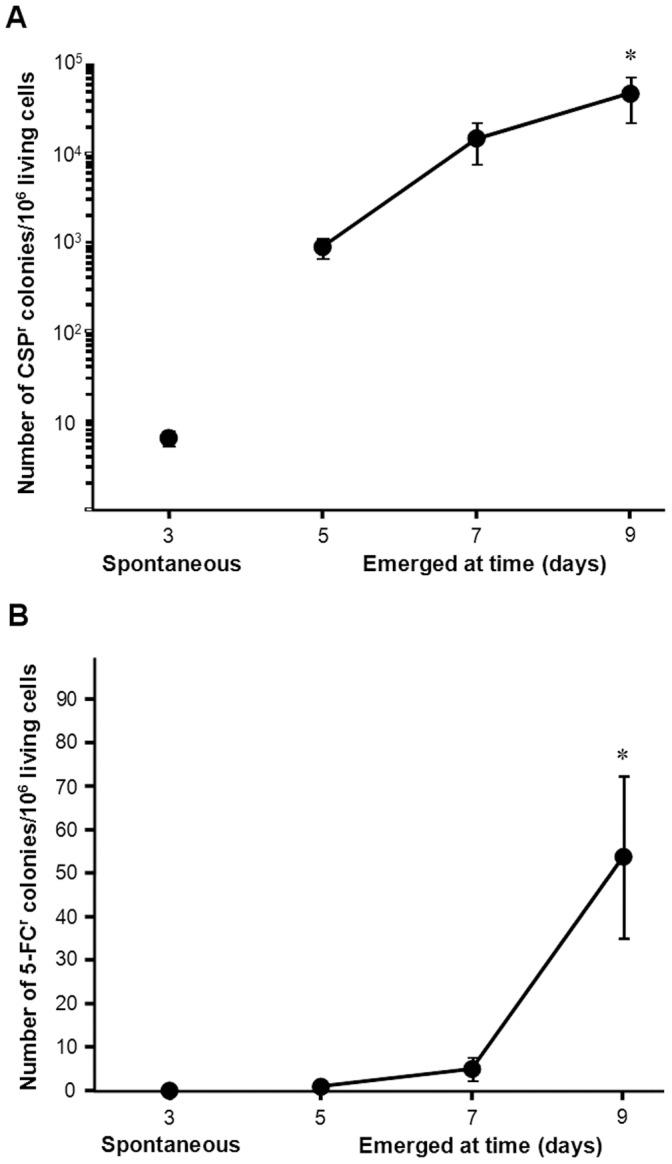
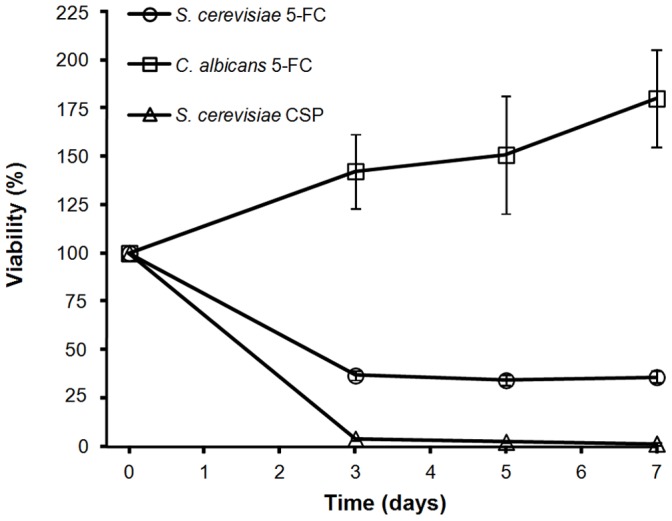
Acquisition of resistance secondary to treatment both by microorganisms and by tumor cells is a major public health concern. Several species of bacteria acquire resistance to various antibiotics through stress-induced responses that have an adaptive mutagenesis effect. So far, adaptive mutagenesis in yeast has only been described when the stress is nutrient deprivation. Here, we hypothesized that adaptive mutagenesis in yeast (Saccharomyces cerevisiae and Candida albicans as model organisms) would also take place in response to antifungal agents (5-fluorocytosine or flucytosine, 5-FC, and caspofungin, CSP), giving rise to resistance secondary to treatment with these agents. We have developed a clinically relevant model where both yeasts acquire resistance when exposed to these agents. Stressful lifestyle associated mutation (SLAM) experiments show that the adaptive mutation frequencies are 20 (S. cerevisiae -5-FC), 600 (C. albicans -5-FC) or 1000 (S. cerevisiae--CSP) fold higher than the spontaneous mutation frequency, the experimental data for C. albicans -5-FC being in agreement with the clinical data of acquisition of resistance secondary to treatment. The spectrum of mutations in the S. cerevisiae -5-FC model differs between spontaneous and acquired, indicating that the molecular mechanisms that generate them are different. Remarkably, in the acquired mutations, an ectopic intrachromosomal recombination with an 87% homologous gene takes place with a high frequency. In conclusion, we present here a clinically relevant adaptive mutation model that fulfils the conditions reported previously.


Conflict of interest statement

Competing Interests: The authors have declared that no competing interests exist.

Figures

Figure 1
Figure 1. Effect of various concentrations of 5-FC in S. cerevisiae.
Behaviour of S. cerevisiae during prolonged incubation on media containing 50 µg/ml (circles), 75 µg/ml (squares), 100 µg/ml (triangles) or 200 µg/ml (cross) 5-FC. (A) Kinetics of the appearance of S. cerevisiae resistant to 5-FC. Cells (5·105) were used to inoculate 5-FC supplemented SC agar medium. Plates were incubated in a moisture chamber at 30°C and scored bidaily for the appearance of 5-FCr colonies. The frequency of 5-FCr cells was calculated as the number of drug resistant colonies observed each day for a given clone divided by the number of cells present on the plates two days earlier (moment when one cell mutated and began giving rise to the visible colony counted). (B) 5-FC leads to some cell death in a concentration dependent manner. Viable colony forming units were determined by recovering cells from 5-FC-containing plates and replating on permissive medium. Survival is shown relative to the number of viable cells present 3 hours after plating on 5-FC (as explained in the Methods section) and is the mean and standard error for 5 independent subpopulations.
Figure 2
Figure 2. Kinetics of acquisition of resistance by S. cerevisiae to 5-FC.
Kinetics of the acquisition of resistance by S. cerevisiae during prolonged incubation on medium containing 100 µg/ml 5-FC. Cells (5·105) were used to inoculate 5-FC supplemented SC agar medium and SLAM experiments performed as described in the Methods section. Mean and standard error for 29 independent subpopulations. * indicates p<0.001 as evaluated by ANOVA with Bonferroni post-hoc test.
Figure 3
Figure 3. Analysis of gross chromosomal rearrangements in S. cerevisiae resistant to 5-FC by pulse-field gel electrophoresis.
CHEF of the chromosomes of a wild-type (WT) and 4 of the secondary 5-FCr strains. The black arrow indicates the only rearrangement found, an apparent deletion in chromosome IV concomitant with a new diffuse band of low molecular weight (grey arrow). Run conditions: 1% agarose gel in 0.5× TBE buffer and run at 14°C for 24 h at 6 V/cm with an initial switching time of 60 seconds, a final of 120 seconds, and an angle of 120°.
Figure 4
Figure 4. Intrachromosomal recombination of FCY2.
Ectopic homologous recombination events found. FCY2, FCY21 and FCY22 are on chromosome V, at the specified distances. After folding, the recombination event takes place, yielding the FCY2r sequences. The arrows mark the start codon in either the Watson or the Crick strands. FCY2w is the wild-type FCY2 sequence; FCY2r are the sequences of three chosen recombinant mutants, and FCY22 is the pseudogen FCY2 has recombined with.
Figure 5
Figure 5. Effects of prolonged exposure to 5-FC on cell cycle progression.
For each panel, resistant colonies were excised from one 150 mm diameter plate and the remaining non-resistant cells were washed off with 80% EtOH to measure DNA contents by FACS as described in Materials and Methods. In each panel the X axis represents the DNA content and the Y axis represents the number of cells. The FACS histograms measured at various times as specified in each panel.
Figure 6
Figure 6. Follow up of S. cerevisiae microcolonies during prolonged exposure to 5-FC.
Follow up of S. cerevisiae microcolonies during prolonged exposure to 5-FC for the specified time. After inoculating a 90 mm diameter Petri dish containing SC medium with 100 µg/ml 5-FC in the same fashion as performed for SLAM experiments, a 6 cm2 slice was cut out and placed on a glass slide and kept in a moist chamber. Random fields were chosen at time 0 and followed through time as specified in the Methods section for the times indicated in each picture. Panel A shows detailed follow up of one field. Adjacent to the field shown in panel B, a cell acquired resistance and grew, eventually invading the followed up field (black arrow). A marked difference can be observed between the edge of microcolonies and the 5-FCr colony.
Figure 7
Figure 7. Fluorescence microscopy of cells exposed to 5-FC for long term.
Effect of 5-FC on nuclear segregation of S. cerevisiae after exposure for the specified time. For each panel, resistant colonies were excised from one 90 mm diameter plate and the remaining non-resistant cells were washed off with sterile H2O and kept at −24°C. On the day of the experiment they were dyed with DAPI and examined by fluorescence microscopy. Left column was obtained using bright field; right column was obtained using fluorescent illumination; central column was digitally obtained by merging the other two. Arrows point to observed anaphase events.
Figure 8
Figure 8. Kinetics of the acquisition of resistance by yeasts during prolonged incubation on drug-containing agar media.
Panel A, 5·106 S. cerevisiae cells (N = 11) were inoculated on SC agar medium supplemented with 0.72 µg/ml CSP. Panel B, 5·105 C. albicans cells (N = 21) were inoculated on agar medium containing 100 µg/ml 5-FC. SLAM experiments were performed as described in Materials and Methods. Mean and standard error for N independent subpopulations (as specified). * indicates p<0.05 as evaluated by ANOVA with Bonferroni post-hoc test.
Figure 9
Figure 9. Effects of antifungal drugs on yeast viability.
Five hundred thousand S. cerevisiae (circles, N = 39) or C. albicans (squares, N = 21) cells were inoculated on agar medium containing 100 µg/ml 5-FC. Five million S. cerevisiae (triangle (N = 11)) cells were inoculated on SC agar medium supplemented with 0.72 µg/ml CSP. Viable colony forming units were determined as specified in figure 1B. Survival is shown relative to the number of viable cells present 3 hours after plating on drug (as explained in the Methods section) and is the mean and standard error for N independent subpopulations.

References

    1. Foster PL (2007) Stress-induced mutagenesis in bacteria. Crit Rev Biochem Mol Biol 42: 373–397. - PMC - PubMed
    1. Lewin CS, Amyes SG (1991) The role of the SOS response in bacteria exposed to zidovudine or trimethoprim. J Med Microbiol 34: 329–332. - PubMed
    1. Maiques E, Ubeda C, Campoy S, Salvador N, Lasa I, et al. (2006) beta-lactam antibiotics induce the SOS response and horizontal transfer of virulence factors in Staphylococcus aureus. J Bacteriol 188: 2726–2729. - PMC - PubMed
    1. Miller C, Thomsen LE, Gaggero C, Mosseri R, Ingmer H, et al. (2004) SOS response induction by beta-lactams and bacterial defense against antibiotic lethality. Science 305: 1629–1631. - PubMed
    1. Rosenberg SM, Thulin C, Harris RS (1998) Transient and heritable mutators in adaptive evolution in the lab and in nature. Genetics 148: 1559–1566. - PMC - PubMed

Publication types