Neuroligin-1 loss is associated with reduced tenacity of excitatory synapses
- PMID: 22860111
- PMCID: PMC3409177
- DOI: 10.1371/journal.pone.0042314
Neuroligin-1 loss is associated with reduced tenacity of excitatory synapses
Abstract
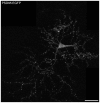
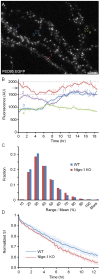
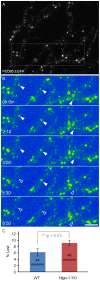
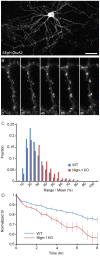
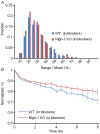
Neuroligins (Nlgns) are postsynaptic, integral membrane cell adhesion molecules that play important roles in the formation, validation, and maturation of synapses in the mammalian central nervous system. Given their prominent roles in the life cycle of synapses, it might be expected that the loss of neuroligin family members would affect the stability of synaptic organization, and ultimately, affect the tenacity and persistence of individual synaptic junctions. Here we examined whether and to what extent the loss of Nlgn-1 affects the dynamics of several key synaptic molecules and the constancy of their contents at individual synapses over time. Fluorescently tagged versions of the postsynaptic scaffold molecule PSD-95, the AMPA-type glutamate receptor subunit GluA2 and the presynaptic vesicle molecule SV2A were expressed in primary cortical cultures from Nlgn-1 KO mice and wild-type (WT) littermates, and live imaging was used to follow the constancy of their contents at individual synapses over periods of 8-12 hours. We found that the loss of Nlgn-1 was associated with larger fluctuations in the synaptic contents of these molecules and a poorer preservation of their contents at individual synapses. Furthermore, rates of synaptic turnover were somewhat greater in neurons from Nlgn-1 knockout mice. Finally, the increased GluA2 redistribution rates observed in neurons from Nlgn-1 knockout mice were negated by suppressing spontaneous network activity. These findings suggest that the loss of Nlgn-1 is associated with some use-dependent destabilization of excitatory synapse organization, and indicate that in the absence of Nlgn-1, the tenacity of excitatory synapses might be somewhat impaired.
Conflict of interest statement
Figures



Similar articles
-
Unique versus Redundant Functions of Neuroligin Genes in Shaping Excitatory and Inhibitory Synapse Properties.J Neurosci. 2017 Jul 19;37(29):6816-6836. doi: 10.1523/JNEUROSCI.0125-17.2017. Epub 2017 Jun 12. J Neurosci. 2017. PMID: 28607166 Free PMC article.
-
SPARCL1 Promotes Excitatory But Not Inhibitory Synapse Formation and Function Independent of Neurexins and Neuroligins.J Neurosci. 2020 Oct 14;40(42):8088-8102. doi: 10.1523/JNEUROSCI.0454-20.2020. Epub 2020 Sep 24. J Neurosci. 2020. PMID: 32973045 Free PMC article.
-
Neuroligin 1 is a postsynaptic cell-adhesion molecule of excitatory synapses.Proc Natl Acad Sci U S A. 1999 Feb 2;96(3):1100-5. doi: 10.1073/pnas.96.3.1100. Proc Natl Acad Sci U S A. 1999. PMID: 9927700 Free PMC article.
-
Neuroligins, synapse balance and neuropsychiatric disorders.Pharmacol Rep. 2014 Oct;66(5):830-5. doi: 10.1016/j.pharep.2014.04.011. Epub 2014 May 9. Pharmacol Rep. 2014. PMID: 25149987 Review.
-
The postsynaptic organization of synapses.Cold Spring Harb Perspect Biol. 2011 Dec 1;3(12):a005678. doi: 10.1101/cshperspect.a005678. Cold Spring Harb Perspect Biol. 2011. PMID: 22046028 Free PMC article. Review.
Cited by
-
Neuroligin 2 is expressed in synapses established by cholinergic cells in the mouse brain.PLoS One. 2013 Sep 5;8(9):e72450. doi: 10.1371/journal.pone.0072450. eCollection 2013. PLoS One. 2013. PMID: 24039767 Free PMC article.
-
Spine dynamics in the brain, mental disorders and artificial neural networks.Nat Rev Neurosci. 2021 Jul;22(7):407-422. doi: 10.1038/s41583-021-00467-3. Epub 2021 May 28. Nat Rev Neurosci. 2021. PMID: 34050339 Review.
-
Linking spontaneous and stimulated spine dynamics.Commun Biol. 2023 Sep 11;6(1):930. doi: 10.1038/s42003-023-05303-1. Commun Biol. 2023. PMID: 37696988 Free PMC article.
-
The role of ionotropic glutamate receptors in childhood neurodevelopmental disorders: autism spectrum disorders and fragile x syndrome.Curr Neuropharmacol. 2014 Jan;12(1):71-98. doi: 10.2174/1570159X113116660046. Curr Neuropharmacol. 2014. PMID: 24533017 Free PMC article.
-
Synaptic size dynamics as an effectively stochastic process.PLoS Comput Biol. 2014 Oct 2;10(10):e1003846. doi: 10.1371/journal.pcbi.1003846. eCollection 2014 Oct. PLoS Comput Biol. 2014. PMID: 25275505 Free PMC article.
References
-
- Shapiro L, Love J, Colman DR (2007) Adhesion molecules in the nervous system: structural insights into function and diversity. Annu Rev Neurosci 30: 451–474. - PubMed
Publication types
MeSH terms
Substances
LinkOut - more resources
Full Text Sources
Molecular Biology Databases
Research Materials

