

Pituitary-specific overexpression of porcine follicle-stimulating hormone leads to improvement of female fecundity in BAC transgenic mice
- PMID: 22860114
- PMCID: PMC3409198
- DOI: 10.1371/journal.pone.0042335
Pituitary-specific overexpression of porcine follicle-stimulating hormone leads to improvement of female fecundity in BAC transgenic mice
Abstract
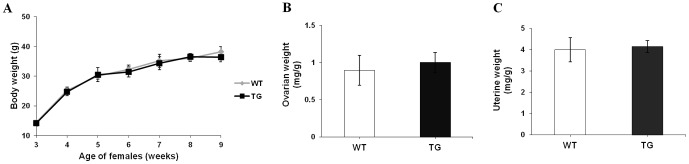
Follicle-stimulating hormone (FSH) is a pituitary glycoprotein that, together with luteinizing hormone, plays a crucial role in ovarian folliculogenesis and female fertility. We previously found that FSH beta is a major gene controlling high prolificacy of Chinese Erhualian pigs. To directly study the biological effects on reproductive function of porcine FSH (pFSH) for polyovulatory species, we generated a novel gain-of-function mouse model using a bacterial artificial chromosome (BAC) system to jointly introduce 92 kb and 165 kb genomic fragments comprising the pFSH α- and β-subunit genes. These directed the physiological expression of pFSH with the same temporal and spatial pattern as endogenous FSH in female transgenic (TG) mice. Serum levels of biologically active pFSH heterodimers in independent TG lines ranged from 6.36 to 19.83 IU/L. High basal pFSH activity led to a significant reduction of serum LH and testosterone levels in TG females compared to wild-type (WT) littermates, yet endogenous FSH and estradiol levels were significantly elevated. Interestingly, ovarian histology showed that the number of corpora lutea was significantly higher at 14 and 28 weeks of age in TG females and breeding curves revealed that mean litter sizes of TG females were obviously larger than for WT littermates before 52 weeks of age. These findings indicate that pituitary-specific overexpression of pFSH within physiological boundaries can increase ovulation rate and litter size, but it does not cause reproductive defects. Therefore, our TG mouse model provides exciting insights for investigating the actions of pFSH in vivo.
Conflict of interest statement
Figures


Similar articles
-
The increased expression of follicle-stimulating hormone leads to a decrease of fecundity in transgenic Large White female pigs.Transgenic Res. 2017 Aug;26(4):515-527. doi: 10.1007/s11248-017-0026-1. Epub 2017 Jun 19. Transgenic Res. 2017. PMID: 28631185
-
Pituitary and ovarian expression of the endogenous follicle-stimulating hormone (FSH) subunit genes and an FSH beta-subunit promoter-driven herpes simplex virus thymidine kinase gene in transgenic mice; specific partial ablation of FSH-producing cells by antiherpes treatment.J Endocrinol. 1996 Aug;150(2):265-73. doi: 10.1677/joe.0.1500265. J Endocrinol. 1996. PMID: 8869593
-
Rising follicle-stimulating hormone levels with age accelerate female reproductive failure.Endocrinology. 2007 Sep;148(9):4432-9. doi: 10.1210/en.2007-0046. Epub 2007 May 31. Endocrinology. 2007. PMID: 17540727
-
A novel transgenic model to characterize the specific effects of follicle-stimulating hormone on gonadal physiology in the absence of luteinizing hormone actions.Endocrinology. 2001 Jun;142(6):2213-20. doi: 10.1210/endo.142.6.8092. Endocrinology. 2001. PMID: 11356665
-
Effects of follicle-stimulating hormone with and without luteinizing hormone on serum hormone concentrations, follicle growth, and intrafollicular estradiol and aromatase activity in gonadotropin-releasing hormone-immunized heifers.Biol Reprod. 2001 Jan;64(1):368-74. doi: 10.1095/biolreprod64.1.368. Biol Reprod. 2001. PMID: 11133695
Cited by
-
Activin Decoy Receptor ActRIIB:Fc Lowers FSH and Therapeutically Restores Oocyte Yield, Prevents Oocyte Chromosome Misalignments and Spindle Aberrations, and Increases Fertility in Midlife Female SAMP8 Mice.Endocrinology. 2016 Mar;157(3):1234-47. doi: 10.1210/en.2015-1702. Epub 2015 Dec 29. Endocrinology. 2016. PMID: 26713784 Free PMC article.
-
The increased expression of follicle-stimulating hormone leads to a decrease of fecundity in transgenic Large White female pigs.Transgenic Res. 2017 Aug;26(4):515-527. doi: 10.1007/s11248-017-0026-1. Epub 2017 Jun 19. Transgenic Res. 2017. PMID: 28631185
-
Production of transgenic-cloned pigs expressing large quantities of recombinant human lysozyme in milk.PLoS One. 2015 May 8;10(5):e0123551. doi: 10.1371/journal.pone.0123551. eCollection 2015. PLoS One. 2015. PMID: 25955256 Free PMC article.
-
Gain-of-Function Genetic Models to Study FSH Action.Front Endocrinol (Lausanne). 2019 Feb 7;10:28. doi: 10.3389/fendo.2019.00028. eCollection 2019. Front Endocrinol (Lausanne). 2019. PMID: 30792692 Free PMC article. Review.
-
Effects of pituitary-specific overexpression of FSHα/β on reproductive traits in transgenic boars.J Anim Sci Biotechnol. 2017 Oct 25;8:84. doi: 10.1186/s40104-017-0208-y. eCollection 2017. J Anim Sci Biotechnol. 2017. PMID: 29090093 Free PMC article.
References
-
- Pierce JG, Parsons TF (1981) Glycoprotein hormones: structure and function. Annu Rev Biochem 50: 465–495. - PubMed
-
- Kato Y, Imai K, Sakai T, Inoue K (1989) Simultaneous effect of gonadotropin-releasing hormone (GnRH) on the expression of two gonadotropin beta genes by passive immunization to GnRH. Mol Cell Endocrinol 62: 135–139. - PubMed
-
- Gharib SD, Wierman ME, Shupnik MA, Chin WW (1990) Molecular biology of the pituitary gonadotropins. Endocr Rev 11: 177–199. - PubMed
-
- Matzuk MM, Kumar TR, Shou W, Coerver KA, Lau AL, et al. (1996) Transgenic models to study the roles of inhibins and activins in reproduction, oncogenesis, and development. Recent Prog Horm Res 51: 123–154; discussion 155–127. - PubMed
-
- Kumar TR, Wang Y, Lu N, Matzuk MM (1997) Follicle stimulating hormone is required for ovarian follicle maturation but not male fertility. Nature Genetics 15: 201–204. - PubMed
Publication types
MeSH terms
Substances
LinkOut - more resources
Full Text Sources
Other Literature Sources
Molecular Biology Databases
Miscellaneous
