. 2012;7(7):e42403.
doi: 10.1371/journal.pone.0042403. Epub 2012 Jul 30.

Evaluating cellular polyfunctionality with a novel polyfunctionality index

Affiliations

Evaluating cellular polyfunctionality with a novel polyfunctionality index

Martin Larsen et al. PLoS One. 2012.

Abstract

Functional evaluation of naturally occurring or vaccination-induced T cell responses in mice, men and monkeys has in recent years advanced from single-parameter (e.g. IFN-γ-secretion) to much more complex multidimensional measurements. Co-secretion of multiple functional molecules (such as cytokines and chemokines) at the single-cell level is now measurable due primarily to major advances in multiparametric flow cytometry. The very extensive and complex datasets generated by this technology raise the demand for proper analytical tools that enable the analysis of combinatorial functional properties of T cells, hence polyfunctionality. Presently, multidimensional functional measures are analysed either by evaluating all combinations of parameters individually or by summing frequencies of combinations that include the same number of simultaneous functions. Often these evaluations are visualized as pie charts. Whereas pie charts effectively represent and compare average polyfunctionality profiles of particular T cell subsets or patient groups, they do not document the degree or variation of polyfunctionality within a group nor does it allow more sophisticated statistical analysis. Here we propose a novel polyfunctionality index that numerically evaluates the degree and variation of polyfuntionality, and enable comparative and correlative parametric and non-parametric statistical tests. Moreover, it allows the usage of more advanced statistical approaches, such as cluster analysis. We believe that the polyfunctionality index will render polyfunctionality an appropriate end-point measure in future studies of T cell responsiveness.


Conflict of interest statement

Competing Interests: The authors have declared that no competing interests exist.

Figures

Figure 1
Figure 1. Theoretical example of polyfunctionality analysis of 3 fictive donors.
A, Bar diagram indicating the frequency of T cells secreting each of the 8 (23) combinations of IFN-γ, TNF-α and IL-2 for three theoretical functional T cell profiles. B, Pie chart representations of the functional T cell profiles. Pies represent the capacity of T cells to secrete none (0) or any (1, 2 or 3) of the three cytokines IFN-γ, TNF-α and IL-2. E.g. the red pie slice indicates the proportion of cells producing three cytokines (IFN-γ, TNF-α and IL-2). C, The polyfunctionality index depicted for each donor as a function of the parameter q defined in equation (1). D, The general polyfunctionality index (Appendix S1) applied to the polyfunctionality profiles of the three donors for q = 1 and φIFN-γ = 0.5 (φTNF-α = φIL-2 = 0).
Figure 2
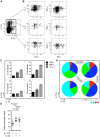
Figure 2. Characterization of IL-17A- and/or IL-22-secreting CD4+ T cells in healthy controls.
A, Representative cytofluorometric analysis of IL-17A and IL-22 intra-cellular expression by peripheral CD4+ T cells following PMA/ionomycin-stimulation. B, Gating on IL-17A+IL-22 (top panel), IL-17A+IL-22+ (middle panel) and IL-17AIL-22+ (bottom panel) CD4+ T cells we then determined their co-secretion of 3 additional cytokines, IFN-γ (black bars), TNF-α (dark gray bars) and IL-2 (light gray bars). C, Bar diagrams depicting individual cytokine responses and D, Pie charts illustrating the polyfunctional profiles of the 4 combinatorial subsets of IL-17A/IL-22-secreting CD4+ T cells from 25 healthy controls. E, Corresponding polyfunctionality index values of IL-17A- and/or IL-22-secreting T cells. Horizontal lines indicate median frequencies, and P-values were calculated using the pie statistic tool integrated in the Spice software and the Wilcoxon signed rank test.
Figure 3
Figure 3. Characterization of EBV-specific CD8+ T cells from SLE patients and healthy controls.
A, Representative cytofluorometric detection (left) and functional analysis (right) of CD8+ T cells specific for one of the lytic EBV antigens tested (BZLF1) pre (upper panel) and post (lower panel) peptide antigen stimulation of PBMCs from a healthy donor. Lytic EBV antigen-specific cells were detected with peptide/MHC tetramer and anti-CD8 antibody (red box) and simultaneously analyzed for intra-cellular IFN-γ, TNF-α, IL-2 and MIP-1β content. Cytokine/chemokine gates were positioned according to control stains of non-stimulated virus-specific T cells. B, EBV-specific T cells are strikingly less polyfunctional in 19 inactive (iSLE) and 27 active (aSLE) SLE patients compared to 26 controls (healthy). Pie representations of virus-specific CD8+ T cells represent the fraction of individual cells secreting none (0) or any (1, 2, 3 or 4) of the four cytokines IFN-γ, TNF-α, IL-2 and MIP-1β (color coded as indicated). E.g. the red pie slice indicates the proportion of cells producing four cytokines (IFN-γ, TNF-α, IL-2 and MIP-1β). C, Polyfunctionality index values of EBV-specific CD8+ T cells from inactive and active SLE patients as well as healthy controls. P-values monitoring differences between healthy donors and SLE patients are calculated using a non-parametric Mann-Whitney test and pie comparison statistics of the Spice software. Pie charts in B were adapted from our previous work.
Figure 4
Figure 4. Associations of HIV-specific polyfunctionality and pathologically pertinent parameters.
A. Representative cytofluorometric detection (left) and functional analysis (right) of CD8+ T cells post HIV-gag overlapping peptide stimulation of PBMCs from an untreated HIV-infected patient. CD8+ T cells (red box) were simultaneously analyzed for intra-cellular IFN-γ, TNF-α, IL-2 and MIP-1β content. Cytokine/chemokine gates were positioned according to control stains of non-stimulated CD8+ T cells. B, CD8+ T cell activation was monitored as CD38 surface expression (black line) versus isotype control (gray shade). C. Polyfunctionality index values correlate with CD8+ T cell activation for 26 HIV-infected donors. D. Hierarchical cluster analysis of CD8+ T cell activation and polyfunctionality generates a dendrogram that objectively separates HIV patients in 2 clusters. E, The two clusters are comprised of HIV patients with significantly different clinical status, defined by their CD4 nadir, HIV viral load, time since infection and age at seroconversion. P-values monitoring differences between clusters are calculated using a non-parametric Mann-Whitney test. Correlations were analyzed with a Spearman test.

References

    1. Sauce D, Almeida JR, Larsen M, Haro L, Autran B, et al. (2007) PD-1 expression on human CD8 T cells depends on both state of differentiation and activation status. AIDS 21: 2005–2013. - PubMed
    1. Sauce D, Larsen M, Abbott RJ, Hislop AD, Leese AM, et al. (2009) Upregulation of interleukin 7 receptor alpha and programmed death 1 marks an epitope-specific CD8+ T-cell response that disappears following primary Epstein-Barr virus infection. J Virol 83: 9068–9078. - PMC - PubMed
    1. Almeida JR, Sauce D, Price DA, Papagno L, Shin SY, et al. (2009) Antigen sensitivity is a major determinant of CD8+ T-cell polyfunctionality and HIV-suppressive activity. Blood 113: 6351–6360. - PMC - PubMed
    1. Papagno L, Alter G, Assoumou L, Murphy RL, Garcia F, et al. (2011) Comprehensive analysis of virus-specific T-cells provides clues for the failure of therapeutic immunization with ALVAC-HIV vaccine. AIDS 25: 27–36. - PubMed
    1. Betts MR, Price DA, Brenchley JM, Lore K, Guenaga FJ, et al. (2004) The functional profile of primary human antiviral CD8+ T cell effector activity is dictated by cognate peptide concentration. J Immunol 172: 6407–6417. - PubMed

Publication types