. 2012;7(7):e42477.
doi: 10.1371/journal.pone.0042477. Epub 2012 Jul 30.

Interspecies avian brain chimeras reveal that large brain size differences are influenced by cell-interdependent processes

Affiliations

Interspecies avian brain chimeras reveal that large brain size differences are influenced by cell-interdependent processes

Chun-Chun Chen et al. PLoS One. 2012.

Abstract

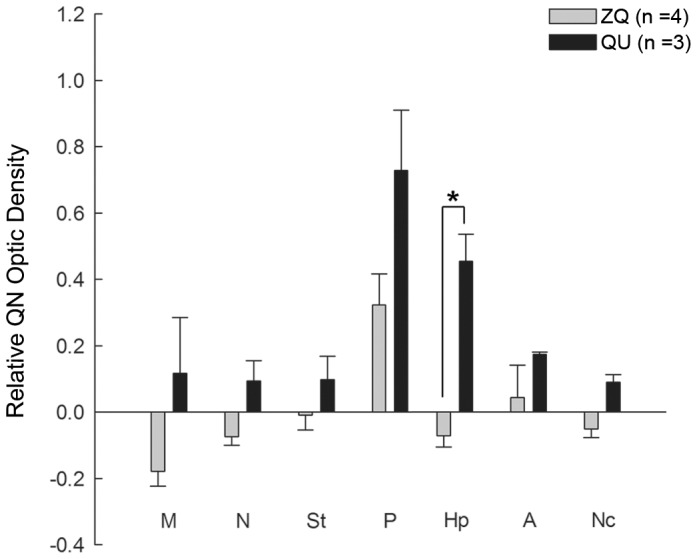
Like humans, birds that exhibit vocal learning have relatively delayed telencephalon maturation, resulting in a disproportionately smaller brain prenatally but enlarged telencephalon in adulthood relative to vocal non-learning birds. To determine if this size difference results from evolutionary changes in cell-autonomous or cell-interdependent developmental processes, we transplanted telencephala from zebra finch donors (a vocal-learning species) into Japanese quail hosts (a vocal non-learning species) during the early neural tube stage (day 2 of incubation), and harvested the chimeras at later embryonic stages (between 9-12 days of incubation). The donor and host tissues fused well with each other, with known major fiber pathways connecting the zebra finch and quail parts of the brain. However, the overall sizes of chimeric finch telencephala were larger than non-transplanted finch telencephala at the same developmental stages, even though the proportional sizes of telencephalic subregions and fiber tracts were similar to normal finches. There were no significant changes in the size of chimeric quail host midbrains, even though they were innervated by the physically smaller zebra finch brain, including the smaller retinae of the finch eyes. Chimeric zebra finch telencephala had a decreased cell density relative to normal finches. However, cell nucleus size differences between each species were maintained as in normal birds. These results suggest that telencephalic size development is partially cell-interdependent, and that the mechanisms controlling the size of different brain regions may be functionally independent.


Conflict of interest statement

Competing Interests: The authors have declared that no competing interests exist.

Figures

Figure 1
Figure 1. The procedure for in ovo transplantation surgery.
(A) Graph showing the relationship of developmental stages and incubation times in zebra finch (white circles; n = 39; dashed line) and quail embryos (black circles; n = 50; solid line). Lines = linear regression. Quail and zebra finch embryos were taken for surgery between HH stages 8 to 13 (arrows). This surgery time window is 30–36 hours (black bar) for quail and 55–60 hours (white bar) for zebra finch eggs. (B) Dorsal view of the neural tube in zebra finch donor before transplantation surgery. (C) Quail host before surgery. (D) Chimera immediately after surgery, labeled with fast green in the finch graft. The finch prosencephalon is outlined with a black line and the quail with a white line. At this stage, the anterior neural tube forms three major parts: 1) prosencephalon (forebrain), 2) mesencephalon (midbrain), and 3) rhombencephalon (hindbrain). White arrow, injection location of the GFP plasmid; dashed white line, location for cutting out the transplanted prosencephalon; black arrow, boundary between zebra finch graft and quail host tissue after transplantation. Scale bar = 250 µm.
Figure 2
Figure 2. Appearance of the zebra finch, chimera, and quail embryo heads at three developmental stages.
Upper row, lateral views of zebra finch embryos and post hatch day 3 animal. *: post hatch day 3 zebra finch is the age most equivalent to embryonic day 16 (ED16) quail. Middle row, zebra finch-quail forebrain chimeras. Bottom row, quail embryos. The eye, forehead, and upper beak of chimeras (white arrows) are derived from zebra finch graft during the surgery, whereas the bottom beak, hind head and necks of chimeras (black arrows) are from quail host.
Figure 3
Figure 3. Three views of zebra finch (ZF), chimera (ZQ), and quail (QU) brains at ED12.
Dorsal (A–C), ventral (D–E), and lateral (F–G) views of whole brain morphology of each of the three groups, showing that the ZQ chimera is intact and well connected between the grafted forebrain and host brain. The zebra finch brain was left inside the thin skull, as removing it as this age is very delicate and the brain was easily destroyed by adhering to the thin skull. This was not the case for the quail and chimera heads. Lines designate subdivision boundaries. T, telencephalon; OT, optic tectum.
Figure 4
Figure 4. Cell histology differences between quail and zebra finch using three staining methods.
(A–B) Hematoxylin and eosin (HE) staining of nuclei in normal zebra finch (A) and quail (B) brain tissue. Arrows point to nucleoli, and show the condensed heterochromatin in the center of the nucleus associated with the nucleolus of the quail cells. (C–D) DAPI staining (blue) in zebra finch (C) and quail (D). Arrows point to nucleoli in the quail cells. Higher magnification of an example of a single zebra finch and quail cell is in the right bottom corner inset of C and D, respectively. The red circle in C is identical in size to the red circle in D, illustrating the nucleus size difference between species. QCPN, quail-specific antibody stains only quail cells (red in F), not zebra finch cells (E) counter stained with DAPI (blue). Scale bar = 10 µm.
Figure 5
Figure 5. Sagittal sections of zebra finch, chimera and quail embryonic brain stained with the QCPN antibody.
QCPN is red and DAPI is blue. (A and B) Stained brain sections of zebra finch at ED9 (left column) and ED12 (right column). (C and D) Stained chimera sections at both ages. White arrows point to the fused boundary of zebra finch graft and quail host between the thalamus and midbrain. (E and F) Stained quail brain sections at both ages.
Figure 6
Figure 6. Localization of finch GFP positive cells in the chimera.
(A) 3D diagram of the zebra finch neural tube, referring to the chicken cell fate map showing the GFP plasmid injection location (green) in the zebra finch and cutting edge during the transplantation. (B–C) GFP positive cells (green dots) and the boundary between the zebra finch and quail tissue (red dots) are labeled on the sagittal brain contour of chimeras at ED9 (B) and ED12 (C). (D–F) Images of the same section from the chimeric thalamus showing DAPI only, GFP positive cells, and a merging of the two images, respectively. GFP positive cells do not have condensed heterochromatin in the nucleolus, confirming that they are zebra finch cells. (G) Image showing the fusion area in the thalamus region labeled with a zebra finch GFP positive cell (without condensed stained nucleolus; yellow arrowhead) intermingled with QCPN positive quail cells (with a condensed stained nucleolus; white arrows). (H–I) GFP positive cell fibers (green; yellow arrowheads) do not overlap with quail neuronal fibers that stain with the quail neuronal marker QN (red; white arrows). Scale bar = 1 mm in B–C, 10 µm in D–H, and 250 µm in I.
Figure 7
Figure 7. Zebra finch GFP positive cells project into chimeric quail hindbrain and zebra finch forebrain.
Embryos are shown with GFP-electroporated zebra finch cells stained with a GFP antibody (green), and all tissue counterstained with DAPI (blue). (A) Chimera brain section at low magnification illustrates GFP stained cells (white arrows) located in the thalamus and GFP positive fibers (white arrowheads) in the spinal cord. (B) Chimera sections in the midbrain area showing the GFP positive fiber tract (thalamic-spinal cord tract) from the thalamic neurons. (C) GFP positive fibers in the quail medulla. (D) GFP positive fibers in the quail spinal cord at higher magnification. (E) GFP positive fibers (yellow arrowheads) in the zebra finch telencephalon passing through the lateral forebrain bundle. (F) GFP positive fibers in the telencephalon, including the pallidum, stratum, nidopallium, and mesopallium. (G) Montage of ED12 chimera brain sections shows the four main tracts of GFP-stained cell fibers: thalamic-spinal cord tract (white arrowheads), thalamic-forebrain tract (yellow arrowheads), thalamic-hypothalamus tract (yellow arrows), and thalamic-habenula tract (white arrows). (H) High magnification view showing GFP positive fibers in finch tissue. (I) High magnification in quail tissue. Panels (A–E) are at ED 9 and (F–I) at ED12. Scale bars = 1 mm in A, 250 µm in B–D, 500 µm in E–F, 200 µm in G and 10 µm in H–I.
Figure 8
Figure 8. Quail neuronal fibers project into quail hindbrain and zebra finch forebrain.
Neuronal fibers are stained with QN or MAP2 antibodies (red) and the cell bodies are stained with DAPI (blue). (A) General distribution of quail neuronal QN stained fibers in a ZQ chimera at ED9. Scale bar = 1 mm. (B) The quail neurons innervate the peripheral tissue of the zebra finch head graft. (C–D) Quail optic ganglion neuron fibers in quail (C), but not in zebra finch retina of chimeras (D). (E–F) Distribution of quail neuronal fibers in quail brainstem (E) is similar to the distribution in chimeras (F) at ED9. However, the optic fibers from zebra finch graft eyes (*) are not stained by QN in chimeras. (G–I) Neuronal fibers patterns of forebrain stained by MAP2 in zebra finch. (J–L) Stained by QN in chimeras. (M–O) Stained by QN in quails. (P–R) Stained by QN in zebra finches. Each column shows a similar section level from medial (left) to lateral (right). The fiber staining of all brain sections shows two similar tracts from pallidum to caudal nidopallium (yellow arrows) and to anterior ventral mesopallium (white arrows) in zebra finch (H–I), chimera (K–L) and quail (N–O). In quail brain sections (M–N), the neuronal fiber tract (yellow arrowheads) is from pallidum through nidopallium to anterior dorsal mesopallium. The QN fibers were strongly stained in the quail hippocampus (N), not in the chimera (K). In chimera (K) and zebra finch (H) sections, the neuronal fiber tract (yellow arrowheads) only extends to the nidopallium. (P–R) The zebra finch forebrain did not stain with the QN antibody, as expected. Scale bar = 1 mm in A, C, and D; 500 µm in B and D.
Figure 9
Figure 9. Relative QN staining optical density in the subregions of the forebrains at ED9.
QN optic densities in the subregions were normalized by the QN staining density in the tectum. QN optical density of the measured forebrain areas in quail embryos was higher than the optical density in chimera embryos (p<0.001; nonparametric two way ANOVA; species×selected brain region). *: p<0.004; t-test in the striatum, pallidum and hippocampus and Mann-Whitney rank sum test in the rest of the areas (n = 3 ZQ and 3 QU). Error bars S.E.M.
Figure 10
Figure 10. Sizes of telencephala, tecta and cell nuclei among zebra finches, chimeras and quails.
(A) Estimated telencephalon volumes at ED9 and ED12. (B) Estimated tectum sizes. (C) Estimated cell nucleus areas. The cells of ZQ were measured from the zebra finch telencephalon and quail tectum in the chimeric embryos. (D) Estimated cell nucleus volumes. *: p<0.05, among groups; a–e: p<0.05 between stages; parametric one-way ANOVA, Tukey's post hoc test (at ED9, n = 4 ZF, 4 ZQ, and 3 QU; at ED12, n = 3 ZF, 3 ZQ, and 3 QU). Error bars, S.E.M.
Figure 11
Figure 11. Quail host environment changes the cell density of the zebra finch telencephalon.
(A) DAPI stained image of representative regions selected for cell density measurements in a quail sagittal sections at ED12. (B) Estimated cell density in subregions at ED9. (C) Estimated cell density in subregions at ED12. (D) Estimated total cell numbers in the telencephala at ED9 and ED12. (E) Estimated total cell numbers in the tecta. *: p<0.04, among groups; a–b: p<0.04 between stages; Kruskal–Wallis one-way ANOVA, Dunn's post hoc test in VZ in (B), St in (C), and in (D); parametric one-way ANOVA, Tukey's post hoc test in rest of regions in B, C and E (at ED9, n = 4 ZF, 4 ZQ, and 3 QU; at ED12, n = 3 ZF, 3 ZQ, and 3 QU). Error bars, S.E.M.
Figure 12
Figure 12. Proportions of telencephalon subregions in chimera at ED9 (A) and ED12 (B).
There were no differences between groups; Kruskal–Wallis one-Way ANOVA, p>0.1 (at ED9, n = 4 ZF, 4 ZQ, and 3 QU; at ED12, n = 3 ZF, 3 ZQ, and 3 QU).

Similar articles

Cited by

References

    1. Striedter GF, Charvet CJ (2009) Telencephalon enlargement by the convergent evolution of expanded subventricular zones. Biol Lett 5: 134–137. - PMC - PubMed
    1. Iwaniuk AN, Hurd PL (2005) The evolution of cerebrotypes in birds. Brain Behav Evol 65: 215–230. - PubMed
    1. Finlay BL, Clancy B, Darlington RB (2010) Late Still Equals Large. Brain Behav Evol 75: 4–6.
    1. Burish MJ, Kueh HY, Wang SS (2004) Brain architecture and social complexity in modern and ancient birds. Brain Behav Evol 63: 107–124. - PubMed
    1. Iwaniuk AN, Dean KM, Nelson JE (2004) A mosaic pattern characterizes the evolution of the avian brain. Proc Biol Sci 271 Suppl 4: S148–151. - PMC - PubMed

Publication types