. 2012 Mar 21;3(3):193-203.
doi: 10.1021/cn200111m. Epub 2011 Dec 20.

A simple method for quantifying functional selectivity and agonist bias

Affiliations

A simple method for quantifying functional selectivity and agonist bias

Terry Kenakin et al. ACS Chem Neurosci. .

Abstract

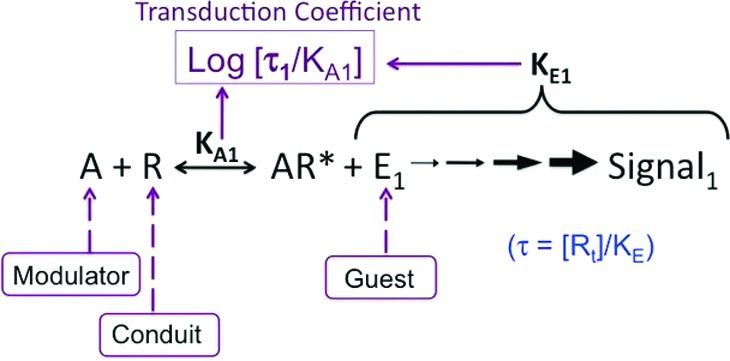
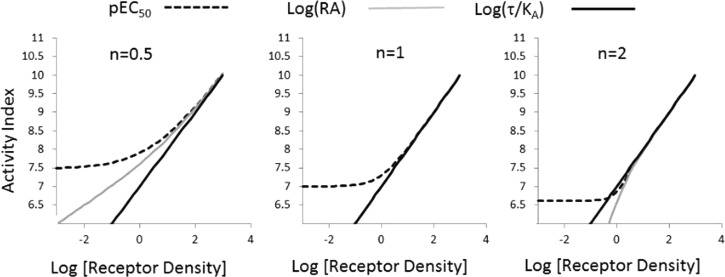
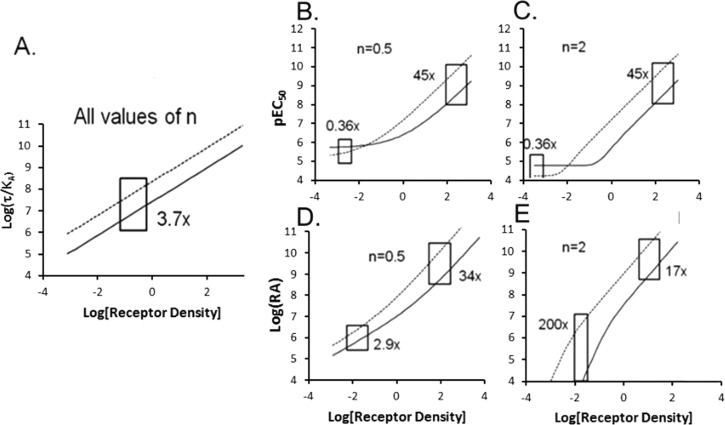
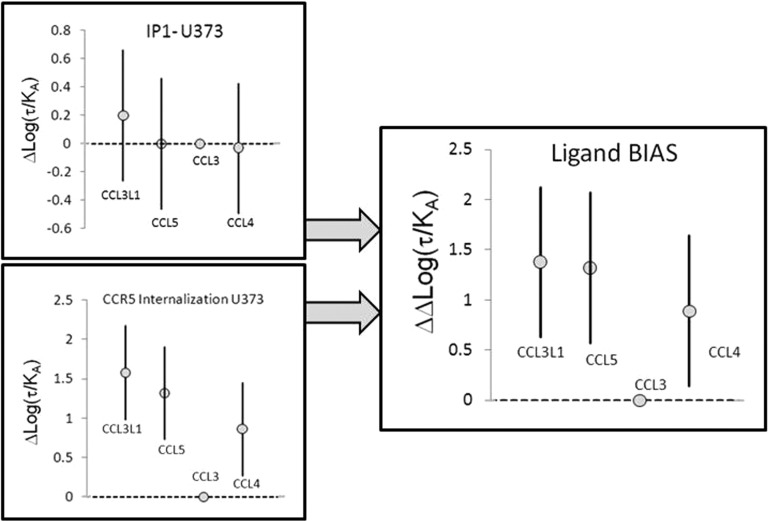
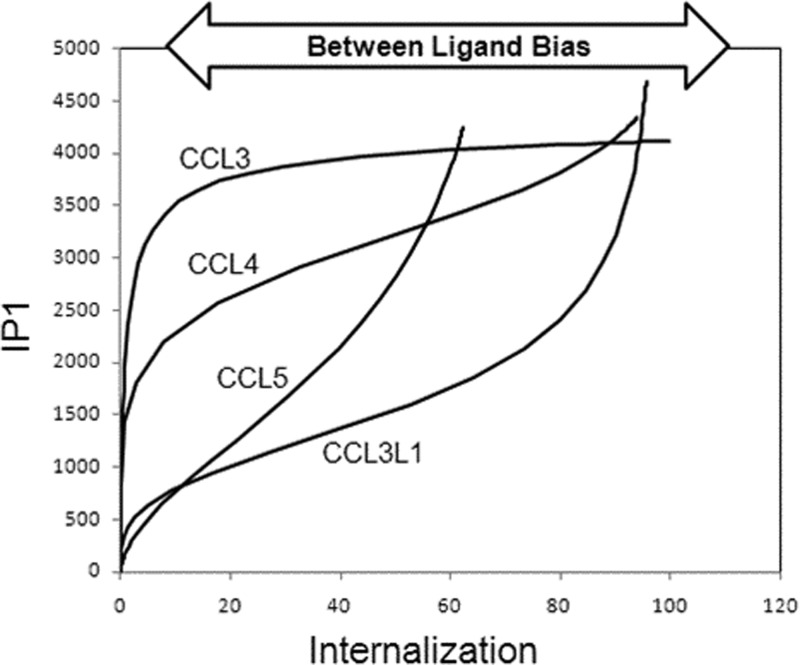
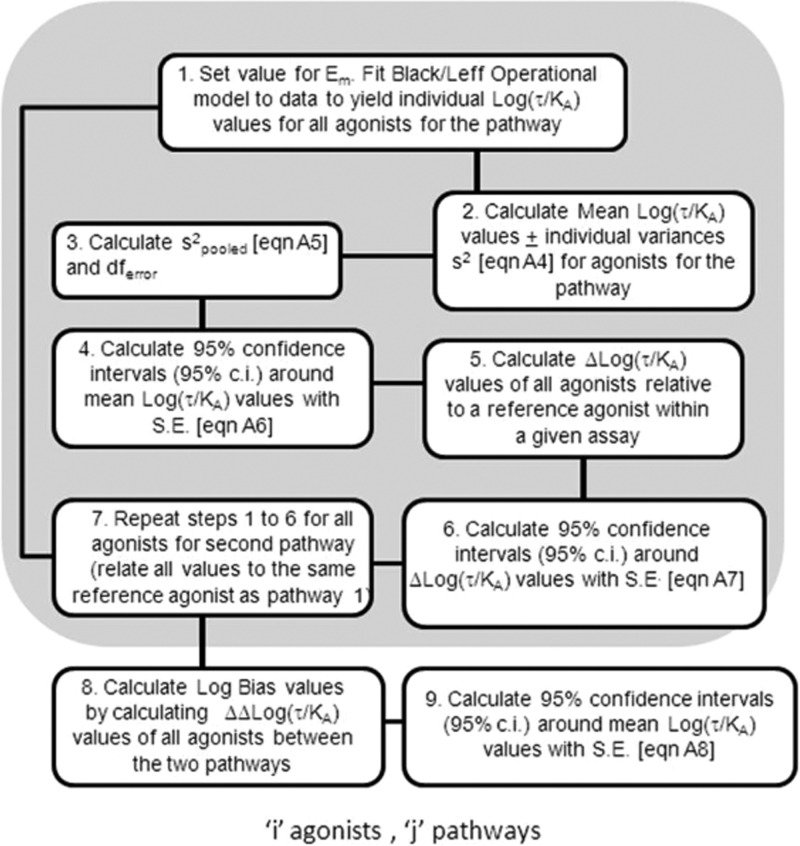
Activation of seven-transmembrane (7TM) receptors by agonists does not always lead to uniform activation of all signaling pathways mediated by a given receptor. Relative to other ligands, many agonists are "biased" toward producing subsets of receptor behaviors. A hallmark of such "functional selectivity" is cell type dependence; this poses a particular problem for the profiling of agonists in whole cell test systems removed from the therapeutic one(s). Such response-specific cell-based variability makes it difficult to guide medicinal chemistry efforts aimed at identifying and optimizing therapeutically meaningful agonist bias. For this reason, we present a scale, based on the Black and Leff operational model, that contains the key elements required to describe 7TM agonism, namely, affinity (K(A) (-1)) for the receptor and efficacy (τ) in activating a particular signaling pathway. Utilizing a "transduction coefficient" term, log(τ/K(A)), this scale can statistically evaluate selective agonist effects in a manner that can theoretically inform structure-activity studies and/or drug candidate selection matrices. The bias of four chemokines for CCR5-mediated inositol phosphate production versus internalization is quantified to illustrate the practical application of this method. The independence of this method with respect to receptor density and the calculation of statistical estimates of confidence of differences are specifically discussed.

Keywords: Biased agonism; drug discovery; functional selectivity; receptor methods; receptor theory; stimulus bias.


Figures

Figure 1
Figure 1
Schematic diagram showing the relevance of the Black–Leff operational model to quantification of agonist bias. The premise is based on the fact that the receptor conformation stabilized by the agonist will have a unique interaction with all signaling proteins that directly interact with it, thereby setting up the allosteric system(s) of modulator (agonist)/conduit (receptor)/guest (signaling protein). Under these circumstances, the affinity and the efficacy (the “quality” of the conformation) will be determined by the signaling protein, and this will be unique for each pathway. The magnitude of log(τ/KA) will be characteristic of both the affinity and efficacy of the agonist for a particular pathway.
Figure 2
Figure 2
Activity scales for agonists as a function of receptor density (e.g., different cell lines). Activities shown are log(τ/KA) (solid black line), pEC50 (dotted line), and log(RA) (gray line) for different agonist concentration–response curve transducer slope coefficients. Curvature in these relationships indicates variation in index with changes in receptor density as simulated by changes in τ, where τ = [Rt]/KE, with KE being constant.
Figure 3
Figure 3
Relative agonist activity as a function of changing receptor density. Values of log(τ/KA), pEC50, and log(RA) for two agonists (one designated with a solid line and the other with a dotted line) were calculated for a range of τ values. (A) Because values of log(τ/KA) do not change with receptor density, the ratio Δlog(τ/KA) remains constant over all ranges of receptor density. (B and C) The pEC50 values change with receptor density for transducer slope coefficients of ≠1, leading to variance and reversal of ΔpEC50 values with receptor density (or changes in receptor coupling efficiency, KE). (D and E) Values of log(RA) change with τ values for slope coefficients of ≠1, leading to differences in the value of Δlog(RA) with varying receptor density as simulated by changes in τ.
Figure 4
Figure 4
Production of IP1 via activation of CCR5 receptors with CCL3L1 (gray filled circles), CCL5 (gray filled triangles), CCL3 (●), and CCL4 (□) in CHO cells expressing different levels of CCR5 as controlled by exposure to BaculoVirus concentrations. Data points represent means of three experiments with curves fit to the operational model to mean data points.
Figure 5
Figure 5
Guinea pig ileal smooth muscle contraction due to activation of muscarinic receptors with carbachol (●) and oxotremorine (○). Control curves show responses in normal tissue, and dashed curves are curves in the same tissue after controlled alkylation of the muscarinic receptor with 1 μM phenoxybenzamine (POB) for 10 min followed by a 2 h drug free wash. Values in boxes refer to log(τ/KA) values for control curves and curves after the reduction in receptor density. Data points represent single curves in one tissue fit to the operational model.
Figure 6
Figure 6
Concentration–response curves for chemokine activation of the CCR5 receptor in U373 cells for production of IP1 (A) and internalization of CCR5 (B). Curves shown for CCL3L1 (●), CCL5 (○), CCL3 (▲), and CCL4 (△). Data points represent the mean ± standard error of the mean of five experiments for IP1 and three experiments for internalization. Curves fitted through the points represent the operational model.
Figure 7
Figure 7
Graphical representations of mean values of Δlog(τ/KA) for IP1 production and CCR5 internalization with 95% confidence intervals. These panels show that the potencies of these agonists are not statistically significantly different for IP1 production but that CCL3L1, CCL5, and CCL4 are significantly more active for producing CCR5 internalization than CCL3. The right panel shows ΔΔlog(τ/KA) values that offset the effects of system bias and compares the relative effects of the agonists on the two responses to a common reference agonist, namely CCL3. It can be seen that CCL3L1, CCL5, and CCL4 are biased at the 95% confidence level for internalization vs IP1 production in U373 cells. Bars represent 95% confidence intervals.
Figure 8
Figure 8
Bias plot for IP1 production (ordinates) and CCR5 internalization (abscissa) for chemokines in U373 cells. Curves represent responses for the two respective pathways at equal concentrations of agonist. The divergence in the curves represents ligand bias based on receptor conformation that should be constant for all systems.
Figure 9
Figure 9
Schematic diagram showing the logistical progression for analysis of agonist bias using the Black–Leff operational model with a statistical assessment of selectivity.

References

    1. Stephenson R. P. (1956) A modification of receptor theory. Br. J. Pharmacol. 11, 379–393. - PMC - PubMed
    1. Furchgott R. F. (1966) The use of β-haloalkylamines in the differentiation of receptors and in the determination of dissociation constants of receptor-agonist complexes. In Advances in Drug Research (Harper N. J., Simmonds A. B., Eds.) Vol. 3, pp 21–55, Academic Press, London.
    1. Kenakin T. P. (2009) A Pharmacology Primer: Theory, Application and Methods, 3rd ed., Academic Press/Elsevier, Amsterdam.
    1. Roth B. L.; Chuang D.-M. (1987) Multiple mechanisms of serotonergic signal transduction. Life Sci. 41, 1051–1064. - PubMed
    1. Lawler C. P.; Prioleua C.; Lewis M. M.; Mak C.; Jiang D.; Schetz J. A.; Gonzalez A. M.; Sibley D. R.; Mailman R. B. (1999) Interactions of the Novel Antipsychotic Aripiprazole (OPC-14597) with Dopamine and Serotonin Receptor Subtypes. Neuropsychopharmacology 20, 612–627. - PubMed

Publication types