. 2013 Feb 1;18(4):386-99.
doi: 10.1089/ars.2012.4615. Epub 2012 Sep 20.

p53 orchestrates the PGC-1α-mediated antioxidant response upon mild redox and metabolic imbalance

Affiliations

p53 orchestrates the PGC-1α-mediated antioxidant response upon mild redox and metabolic imbalance

Katia Aquilano et al. Antioxid Redox Signal. .

Abstract

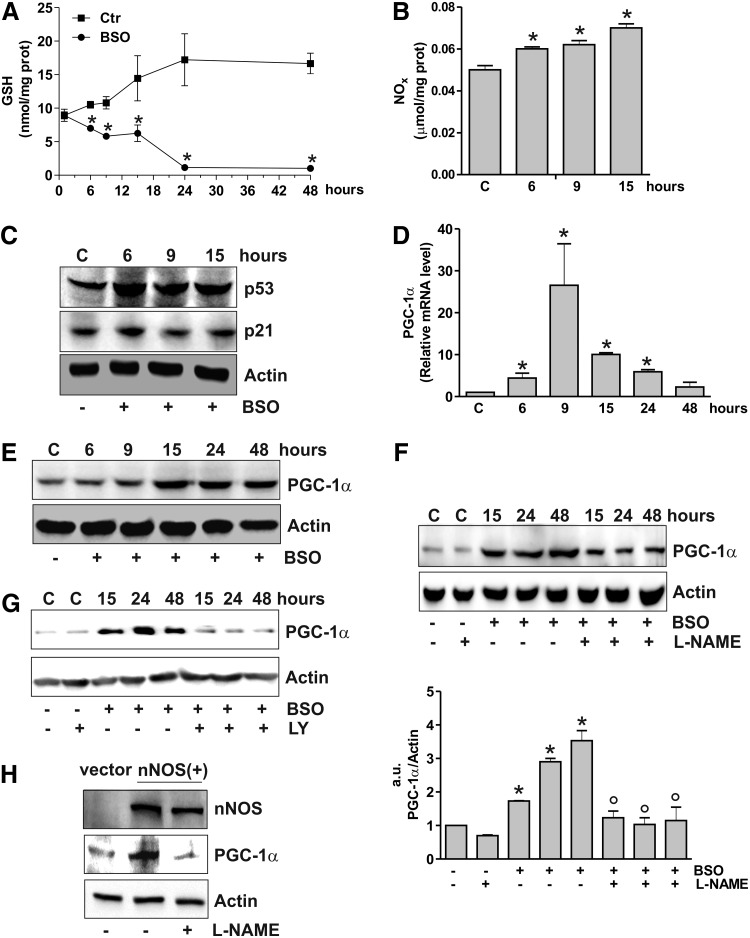
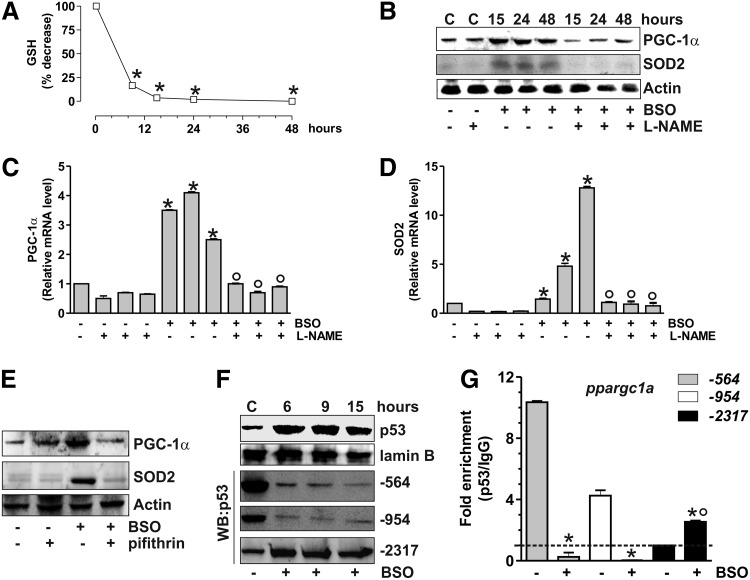
Aims: The transcriptional coactivator peroxisome proliferator-activated receptor-γ coactivator-1 α (PPARGC1A or PGC-1α) is a powerful controller of cell metabolism and assures the balance between the production and the scavenging of pro-oxidant molecules by coordinating mitochondrial biogenesis and the expression of antioxidants. However, even though a huge amount of data referring to the role of PGC-1α is available, the molecular mechanisms of its regulation at the transcriptional level are not completely understood. In the present report, we aim at characterizing whether the decrease of antioxidant glutathione (GSH) modulates PGC-1α expression and its downstream metabolic pathways.

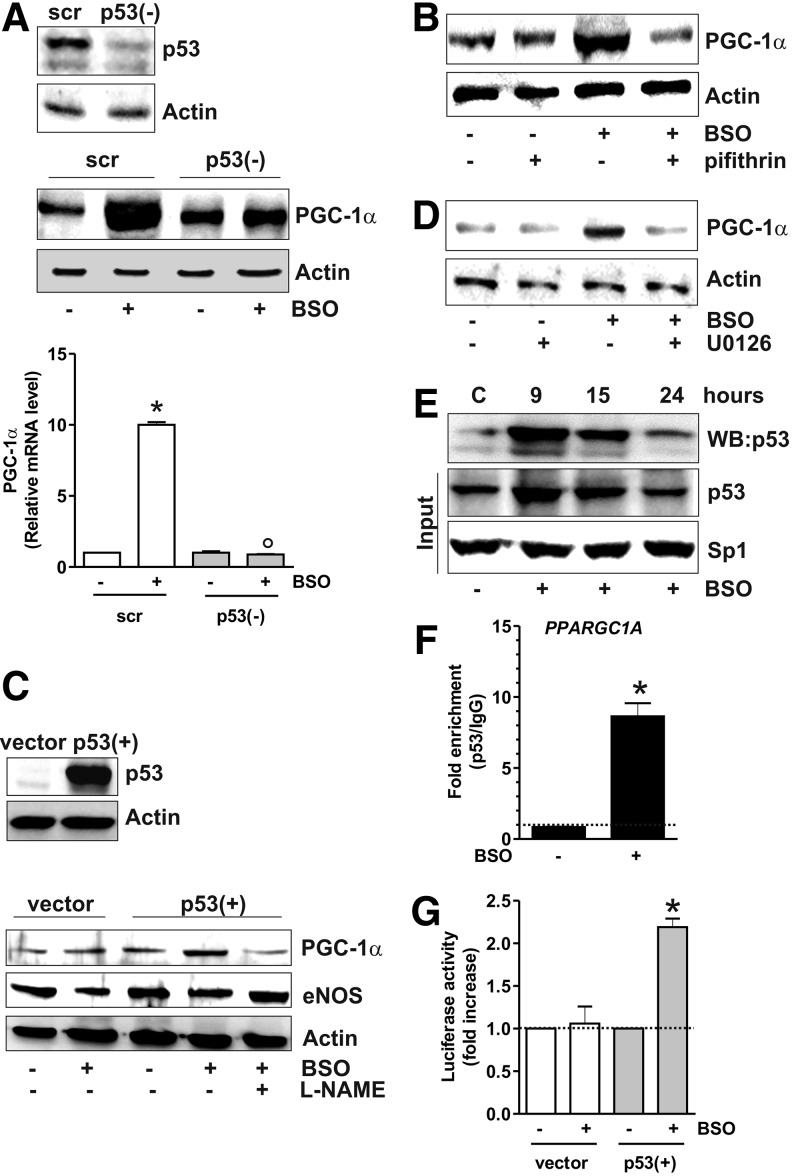
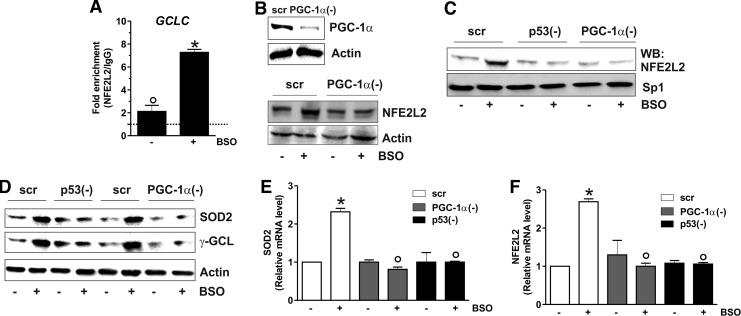
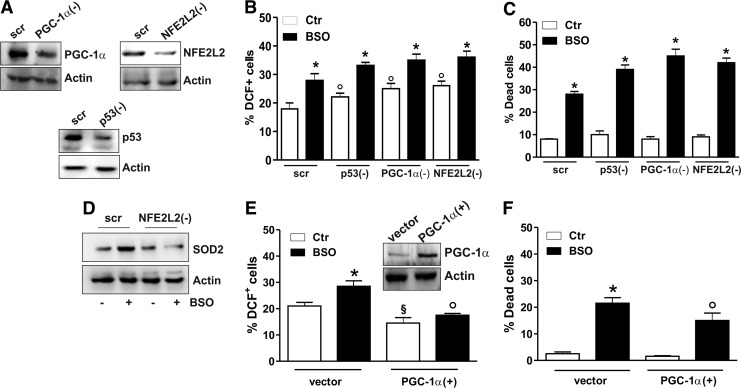
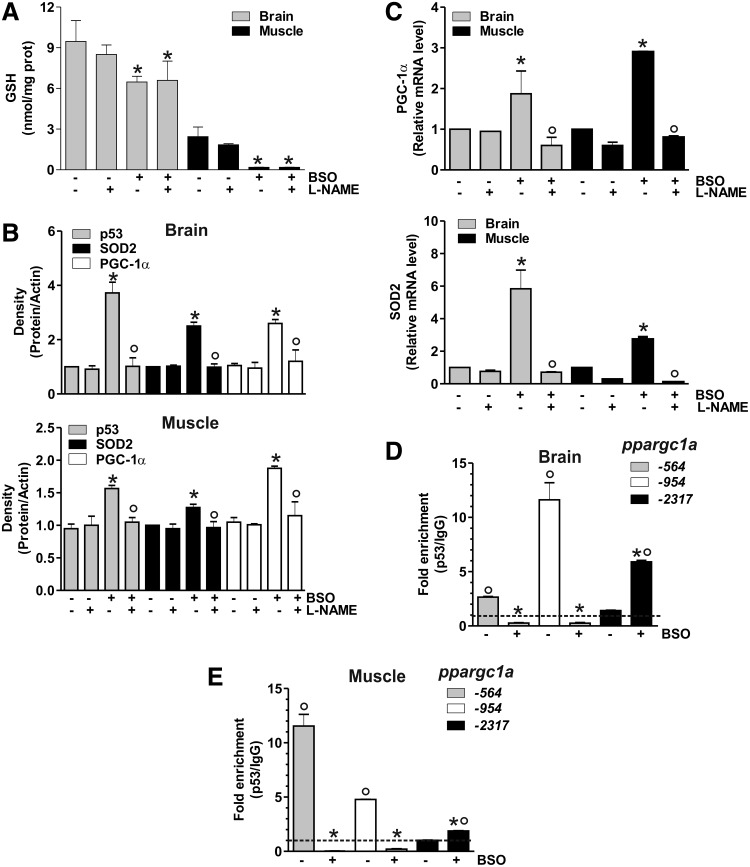
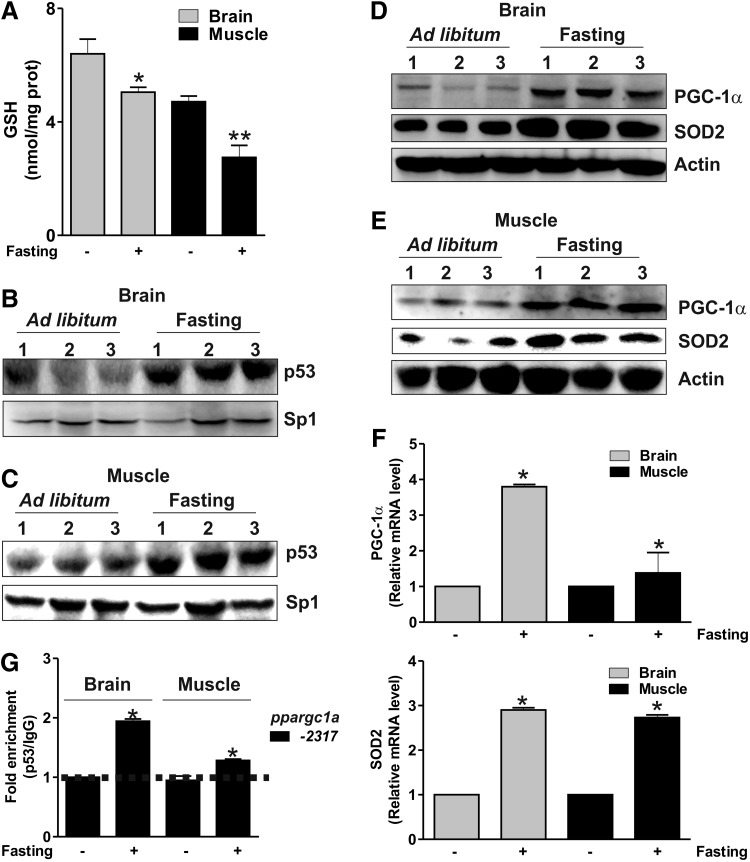
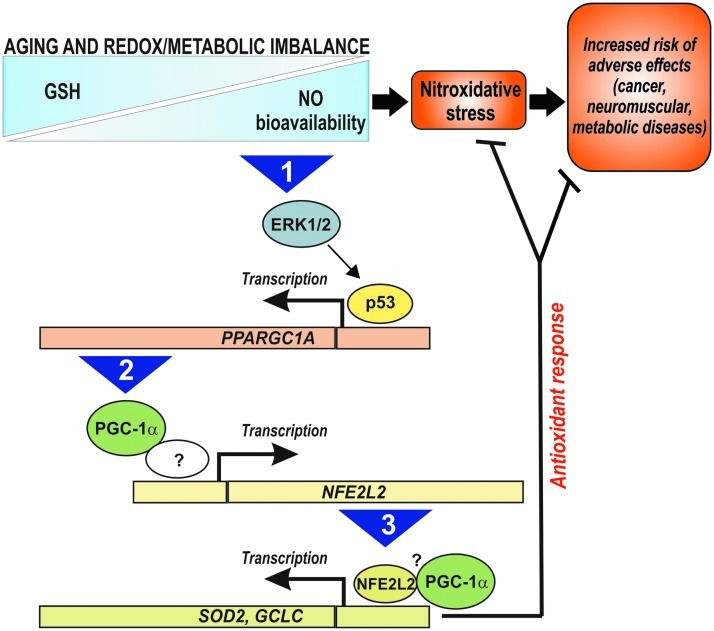
Results: We found that upon GSH shortage, induced either by its chemical depletion or by metabolic stress (i.e., fasting), p53 binds to the PPARGC1A promoter of both human and mouse genes, and this event is positively related to increased PGC-1α expression. This effect was abrogated by inhibiting nitric oxide (NO) synthase or guanylate cyclase, implicating NO/cGMP signaling in such a process. We show that p53-mediated PGC-1α upregulation is directed to potentiate the antioxidant defense through nuclear factor (erythroid-derived 2)-like2 (NFE2L2)-mediated expression of manganese superoxide dismutase (SOD2) and γ-glutamylcysteine ligase without modulating mitochondrial biogenesis.

Innovation and conclusions: We outlined a new NO-dependent signaling axis responsible for survival antioxidant response upon mild metabolic stress (fasting) and/or oxidative imbalance (GSH depletion). Such signaling axis could become the cornerstone for new pharmacological or dietary approaches for improving antioxidant response during ageing and human pathologies associated with oxidative stress.


Figures

FIG. 1.
FIG. 1.
GSH depletion leads to NO/p53-dependent PGC-1α upregulation. (A) SH-SY5Y cells were treated with BSO (1 mM) for the indicated times. GSH content was assayed by HPLC, and data are expressed as means±SD (n=4, *p<0.001 vs. control). (B) Nitrite plus nitrate (NOx) in the culture medium were determined by the Griess reaction. Data are reported as micromoles per milligram of protein and expressed as means±SD (n=4, *p<0.001 vs. control). (C) Cells were lysed, and 20 μg of proteins was loaded for Western blot analysis of p53 and p21. (D) Total RNA was isolated, and relative mRNA level of PGC-1α was analyzed by RT-qPCR. Data are expressed as means±SD (n=6, *p<0.001 vs. control). (E) Cells were lysed, and 20 μg of proteins was loaded for Western blot analysis of PGC-1α. (F) L-NAME (0.1 mM) was added 1 h before BSO treatment and maintained throughout the experiment. Cells were lysed, and 20 μg of proteins was loaded for Western blot analysis of PGC-1α. Density of immunoreactive bands was calculated using the software Quantity one (Bio-Rad), and data are shown as the ratio of PGC-1α/actin. Data are expressed as means±SD (n=4, *p<0.001 vs. control, °p<0.001 vs. BSO-treated cells). (G) LY (0.002 mM) was added 1 h before BSO treatment and maintained throughout the experiment. Cells were lysed, and 20 μg of proteins was loaded for Western blot analysis of PGC-1α. (H) SH-SY5Y cells were transfected with an empty vector (vector) or with nNOS cDNA [nNOS(+)]. L-NAME (0.1 mM) was added 1 h before BSO treatment (15 h) and maintained throughout the experiment. Cells were lysed, and 20 μg of proteins was loaded for Western blot analysis of nNOS and PGC-1α. All the immunoblots reported are from one experiment representative of four that gave similar results. Actin was used as loading control. BSO, l-buthionine sulfoximine; L-NAME, l-NG-nitroarginine methyl ester; NOS, nitric oxide synthase; RT-qPCR, reverse transcription–quantitative polymerase chain reaction; nNOS, neuronal NOS; PGC-1α, peroxisome proliferator-activated receptor-γ coactivator-1 α.
FIG. 2.
FIG. 2.
p53 positively influences PGC-1α transcription. (A) SH-SY5Y cells were transfected with scramble (scr) or p53 siRNA [p53(−)] and treated with BSO for 15 h. Cells were lysed, and 20 μg of proteins was loaded for Western blot analysis of p53 and PGC-1α. Total RNA was isolated, and the relative mRNA level of PGC-1α was analyzed by RT-qPCR. Data are expressed as means±SD (n=6, *p<0.001 vs. BSO-untreated scr, °p<0.001 vs. BSO-treated scr). (B) Pifithrin (0.02 mM) was added 1 h before BSO treatment (15 h) and maintained throughout the experiment. Cells were lysed, and 20 μg of proteins was loaded for Western blot analysis of PGC-1α. (C) NCI-H1299 cells was transfected with pcDNA 3.1 empty vector (vector) or pcDNA 3.1 wild-type p53 cDNA [p53(+)]. L-NAME (0.01 mM) was added 1 h before BSO treatment (15 h) and maintained throughout the experiment. Cells were lysed, and 20 μg of proteins was loaded for Western blot analysis of eNOS and PGC-1α. (D) U0126 (260 nM) was added 1 h before BSO treatment (15 h) in SH-SY5Y cells and maintained throughout the experiment. Cells were lysed, and 20 μg of proteins was loaded for Western blot analysis of PGC-1α. (E) SH-SY5Y cells were treated with BSO treatment for the indicated times. Five hundred μg of nuclear protein extracts was subjected to oligo-pulldown assay by using the biotinylated oligonucleotide representing the putative p53RE on the PPARGC1A promoter and bound p53 was detected by Western blot. Twenty micrograms of nuclear proteins (input) was used for Western blot analysis of p53 and Sp1. (F) After 9 h from BSO treatment, ChIP assay was carried out on cross-linked nuclei from SH-SY5Y cells using p53 antibody followed by qPCR analysis of p53RE. Dashed line indicates the value of IgG control. Data are expressed as means±SD (n=3, *p<0.001 vs. control). (G) NCI-H1299 cells were transfected with pGL3 Vector containing the PPARGC1A promoter (+1/-1600 bp) together with pcDNA 3.1 empty vector (vector) or pcDNA 3.1 wild-type p53 cDNA [p53(+)]. Normalized luciferase activities were expressed as fol increase with respect to the values from control, which were set arbitrarily at 1. Data are expressed as means±SD (n=3, *p<0.001 vs. control). All the immunoblots reported are from one experiment representative of four that gave similar results. Actin was used as loading control. ChIP, chromatin immunoprecipitation assay.
FIG. 3.
FIG. 3.
PGC-1α upregulation is associated with NFE2L2-mediated SOD2 and γ-GCL increase. (A) SH-SY5Y cells were treated with BSO for the indicated times. Total RNA was isolated, and the relative mRNA level of NRF-1 was analyzed by RT-qPCR. Data are expressed as means±SD (n=4). Cells were lysed, and 20 μg of proteins was used for Western blot analysis of NRF-1 (B) Total RNA was isolated, and the relative mRNA level of TFAM was analyzed by RT-qPCR. Data are expressed as means±SD (n=5). Cells were lysed, and 20 μg of proteins was used for Western blot analysis of TFAM. (C) Total RNA was isolated, and the relative mRNA level of NFE2L2 was analyzed by RT-qPCR. Data are expressed as means±SD (n=4, *p<0.001 vs. control). Cells were lysed, and 20 μg of proteins was used for Western blot analysis of NFE2L2. Cells were lysed, and 20 μg of proteins was used for Western blot analysis of SOD2, Trx1, catalase, SOD1 (D), and γ-GCL (E). Total RNA was isolated, and relative mRNA level of SOD2 (F) and γ-GCL (G) was analyzed by RT-qPCR. Data are expressed as means±SD (n=4, *p<0.001 vs. control). All the immunoblots reported are from one experiment representative of four that gave similar results. Actin was used as loading control. γ-GCL, γ-glutamylcysteine ligase; NRF-1, nuclear respiratory factor-1; SOD2, manganese superoxide dismutase; NFE2L2, nuclear factor (erythroid-derived 2)-like2; TFAM, mitochondrial transcription factor A.
FIG. 4.
FIG. 4.
p53/PGC-1α/NFE2L2 axis induces SOD2 and γ-GCL. (A) After 15 h from BSO treatment, ChIP assay was carried out on cross-linked nuclei from SH-SY5Y cells by using NFE2L2 antibody followed by qPCR analysis of ARE sequence on the GCLC promoter. Dashed line indicates the value of IgG control. Data are expressed as means±SD (n=3, *p<0.001 vs. control; °p<0.01 vs. IgG). (B) SH-SY5Y cells were transfected with scramble (scr) or PGC-1α siRNA [PGC-1α(−)] and treated with BSO for 15 h. PGC-1α and NFE2L2 were detected by Western blot. (C) SH-SY5Y cells were transfected with scramble (scr) or PGC-1α siRNA [PGC-1α(−)] or p53 siRNA [p53(−)] and treated with BSO for 15 h. Nuclear protein extracts (500 μg) were subjected to oligo-pulldown assay using the biotinylated oligonucleotide representing the NFE2L2 consensus sequence on the GCLC promoter. (D) SH-SY5Y cells were transfected with scramble (scr) or PGC-1α siRNA [PGC-1α(−)] or p53 siRNA [p53(−)] and treated with BSO for 15 h. Cells were lysed, and 20 μg of proteins was used for Western blot analysis of SOD2 and γ-GCL. (E, F) SH-SY5Y cells were transfected with scramble (scr) or PGC-1α siRNA [PGC-1α(−)] or p53 siRNA [p53(−)] and treated with BSO for 15 h. Total RNA was isolated, and relative mRNA level of SOD2 (E) and NFE2L2 (F) was analyzed by RT-qPCR. Data are expressed as means±SD (n=4, *p<0.001 vs. BSO-untreated scr, °p<0.001 vs. BSO-treated scr). All the immunoblots reported are from one experiment representative of five that gave similar results. Actin or Sp1 were used as loading control.
FIG. 5.
FIG. 5.
PGC-1α prevents oxidative stress and cell death mediated by the loss of GSH. (A–C) SH-SY5Y cells were transfected with scramble (scr) or PGC-1α siRNA [PGC-1α(−)], p53 siRNA [p53(−)], or NFE2L2 siRNA [NFE2L2(−)] and treated with BSO for 15 h. (A) PGC-1α, p53, and NFE2L2 downregulation was detected by Western blot analysis. (B) Cells were treated with BSO for 15 h and assayed for ROS/ONOO production by cytofluorimetric analysis after DCF-DA staining. ROS/ONOO level was reported as percentage of DCF-positive cells and expressed as means±SD (n=4, *p<0.001 vs. BSO-untreated scr; °p<0.01 vs. BSO-treated and untreated scr). (C) Cells were treated with BSO for 48 h, and dead cells were counted by Trypan blue exclusion. Data are expressed as means±SD (n=5, *p<0.001 vs. BSO-untreated scr). (D) SH-SY5Y cells were transfected with scramble (scr) or NFE2L2 siRNA [NFE2L2(−)] and treated with BSO for 15 h. Cells were lysed, and 20 μg of proteins was used for Western blot analysis of SOD2. (E) SH-SY5Y cells were transfected with empty vector (vector) or with PGC-1α cDNA [PGC-1α(+)] and treated with BSO for 15 h. PGC-1α upregulation (inset) was detected by Western blot. Cells were assayed for ROS/ONOO production by cytofluorimetric analysis after DCF-DA staining. ROS/ONOO level was reported as percentage of DCF-positive cells and expressed as means±SD (n=4, *p<0.01 vs. vector-untreated cells; °p<0.001 vs. BSO-treated vector, §p<0.01 vs. BSO-untreated vector). (F) Cells were treated with BSO for 48 h, and dead cells were counted by Trypan blue exclusion. Data are expressed as means±SD (n=5, *p<0.001 vs. vector-untreated cells; °p<0.01 vs. BSO-treated vector). All the immunoblots reported are from one experiment representative of four that gave similar results. Actin was used as loading control. ROS, reactive oxygen species.
FIG. 6.
FIG. 6.
p53 modulates PGC-1α transcription in murine C2C12 cells upon GSH depletion. (A) C2C12 cells were treated with BSO (1 mM) for the indicated times. GSH content was assayed by HPLC, and data are expressed as percentage of decrease with respect to controls and reported as means±SD (n=4, *p<0.001 vs. control). (B) C2C12 cells were treated with BSO and/or L-NAME (0.1 mM) for the indicated times. Cells were lysed, and 20 μg of proteins was used for Western blot analysis of PGC-1α and SOD2. Total RNA was isolated, and relative mRNA level of PGC-1α (C) and SOD2 (D) was analyzed by RT-qPCR. Data are expressed as means±SD (n=4, *p<0.001 vs. control, °p<0.001 vs. BSO and NAME-treated cells). (E) Pifithrin (0.02 mM) was added 1 h before BSO treatment (15 h) and maintained throughout the experiment. Cells were lysed, and 20 μg of proteins was loaded for Western blot analysis of PGC-1α and SOD2. (F) After BSO treatment, C2C12 nuclear protein extracts (500 μg) were subjected to Western blot analysis of p53 and oligo-pulldown assay by using the biotinylated oligonucleotides representing the three p53REs on the ppargc1a promoter (−564, −954, and −2317). (G) After 15 h from BSO treatment, ChIP assay was carried out on cross-linked nuclei from C2C12 cells by using p53 antibody, followed by qPCR analysis of p53REs on the ppargc1a promoter (−564, −954, and −2317). Dashed line indicates the value of IgG control (n=3, *p<0.001 vs. control; °p<0.01 vs. IgG).
FIG. 7.
FIG. 7.
p53 positively regulates PGC-1α transcription in mice upon GSH depletion. (A) C57/BL6 mice were treated with BSO (20 mM) and/or L-NAME (4 mM) for 5 weeks in drinking water. Brains and skeletal muscles were homogenized, and GSH content was assayed by HPLC. Data are expressed as nmoles of GSH/mg of proteins and reported as means±SD (n=5, *p<0.001 vs. control). (B) Brains and skeletal muscles were homogenized, and 50 μg of proteins was used for Western blot analysis of p53, SOD2 and PGC-1α. Density of immunoreactive bands was calculated using the software Quantity one (Bio-Rad), and data are shown as a ratio of protein/actin. Data are expressed as means±SD (n=5, *p<0.01 vs. control, °p<0.01 vs. BSO-treated cells). (C) Total RNA was isolated, and relative mRNA level of PGC-1α and SOD2 were analyzed by RT-qPCR. Data are expressed as means±SD (n=4, *p<0.01 vs. control, °p<0.01 vs. BSO-treated cells). ChIP assay was carried out on cross-linked nuclei from the brain (D) and skeletal muscle (E) by using p53 antibody followed by qPCR analysis of p53REs on the ppargc1a promoter (−564, −954, and −2317). Dashed line indicates the value of IgG control (n=3, *p<0.001 vs. control; °p<0.01 vs. IgG). All the immunoblots reported are from one experiment representative of four that gave similar results. Actin was used as loading control.
FIG. 8.
FIG. 8.
p53 binding to the ppargc1a promoter is modulated by fasting. (A) CD1 mice were either fed ad libitum or fasted for 24 h. Brains and skeletal muscles were homogenized, and GSH content was assayed by HPLC. Data are expressed as nmoles of GSH/mg of proteins and reported as means±SD (n=4, *p<0.001 vs. control). Nuclear proteins (50 μg) from the brain (B) and skeletal muscle (C) of ad libitum fed or fasted mice were subjected to Western blot analysis of p53. Twenty micrograms of total brain (D) or skeletal muscle (E) proteins from three ad libitum fed or fasted mice was loaded for the detection of PGC-1α and SOD2 by Western blot. (F) Total RNA was isolated, and relative mRNA level of PGC-1α and SOD2 was analyzed by RT-qPCR. Data are expressed as means±SD (n=6, *p<0.001 vs. control). (G) ChIP assay was carried out on cross-linked nuclei from the brain and skeletal muscle from ad libitum fed or fasted mice by using p53 antibody, followed by qPCR analysis of p53RE on the ppargc1a promoter (−2317). Dashed line indicates the value of IgG control (n=3, *p<0.001 vs. ad libitum fed). All the immunoblots reported are from one experiment representative of four that gave similar results. Actin or Sp1 were used as loading control.
FIG. 9.
FIG. 9.
Schematic model of the signaling pathway activated by redox/metabolic imbalance and its possible positive impact on human lifespan. Question marks represent possible still-undiscovered molecular mechanisms/factors regulating the transcription and activity of NFE2L2. The numbers in the arrows indicate the sequence of events. GSH, glutathione; ERK1/2, extracellular-regulated kinase 1/2; GCLC, γ-glutamylcysteine ligase, catalytic subunit.

References

    1. Aquilano K. Baldelli S. Cardaci S. Rotilio G. Ciriolo MR. Nitric oxide is the primary mediator of cytotoxicity induced by GSH depletion in neuronal cells. J Cell Sci. 2011;124:1043–1054. - PubMed
    1. Aquilano K. Vigilanza P. Baldelli S. Pagliei B. Rotilio G. Ciriolo MR. Peroxisome proliferator-activated receptor gamma co-activator 1alpha (PGC-1alpha) and sirtuin 1 (SIRT1) reside in mitochondria: possible direct function in mitochondrial biogenesis. J Biol Chem. 2010;285:21590–21599. - PMC - PubMed
    1. Aquilano K. Vigilanza P. Rotilio G. Ciriolo MR. Mitochondrial damage due to SOD1 deficiency in SH-SY5Y neuroblastoma cells: a rationale for the redundancy of SOD1. FASEB J. 2006;20:1683–1685. - PubMed
    1. Baldelli S. Aquilano K. Rotilio G. Ciriolo MR. Glutathione and copper, zinc superoxide dismutase are modulated by overexpression of neuronal nitric oxide synthase. Int J Biochem Cell Biol. 2008;40:2660–2670. - PubMed
    1. Baldelli S. Aquilano K. Rotilio G. Ciriolo MR. Neuronal nitric oxide synthase interacts with Sp1 through the PDZ domain inhibiting Sp1-mediated copper-zinc superoxide dismutase expression. Int J Biochem Cell Biol. 2011;43:163–169. - PubMed

Publication types

MeSH terms