. 2012 Aug 3;150(3):620-32.
doi: 10.1016/j.cell.2012.06.027.

Brown remodeling of white adipose tissue by SirT1-dependent deacetylation of Pparγ

Affiliations

Brown remodeling of white adipose tissue by SirT1-dependent deacetylation of Pparγ

Li Qiang et al. Cell. .

Abstract

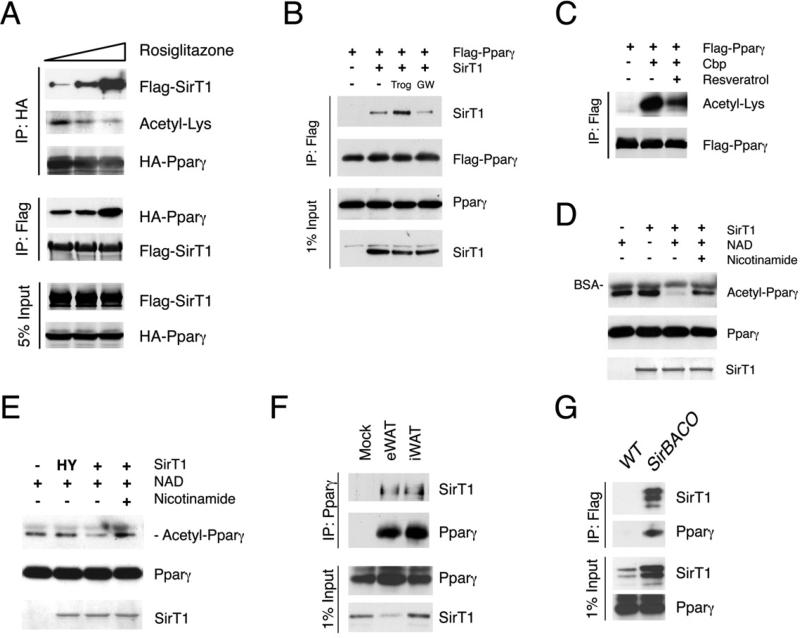
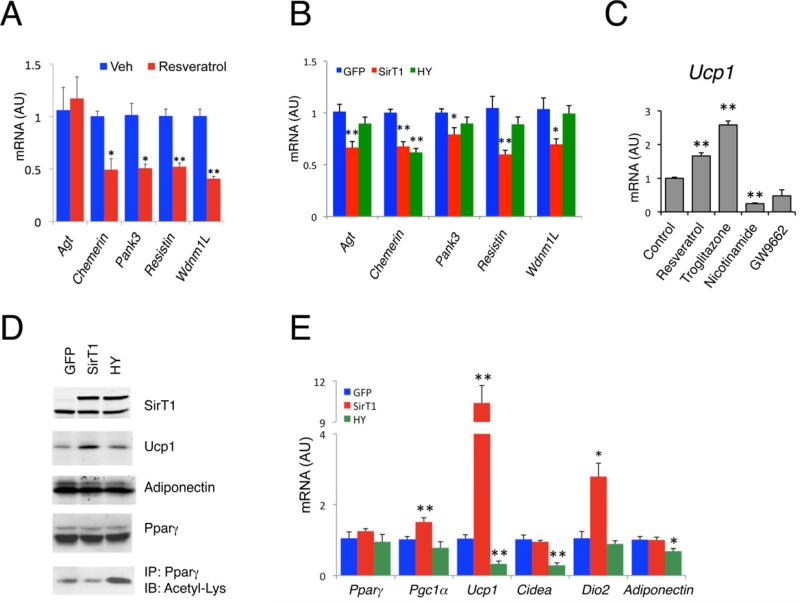
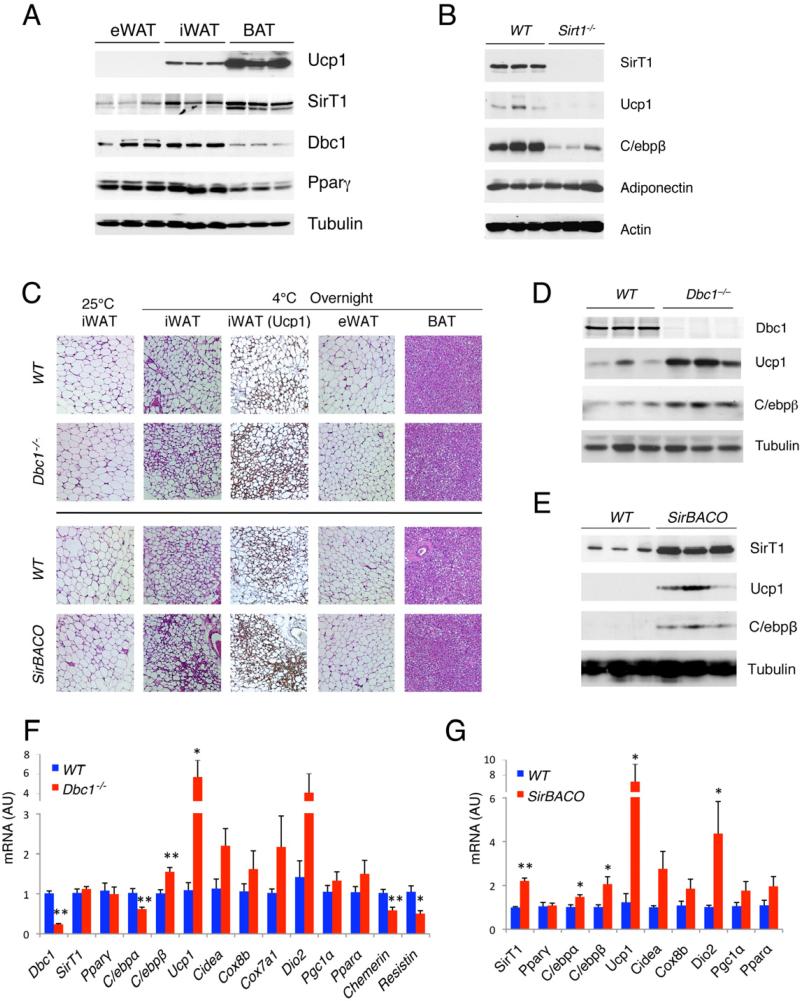
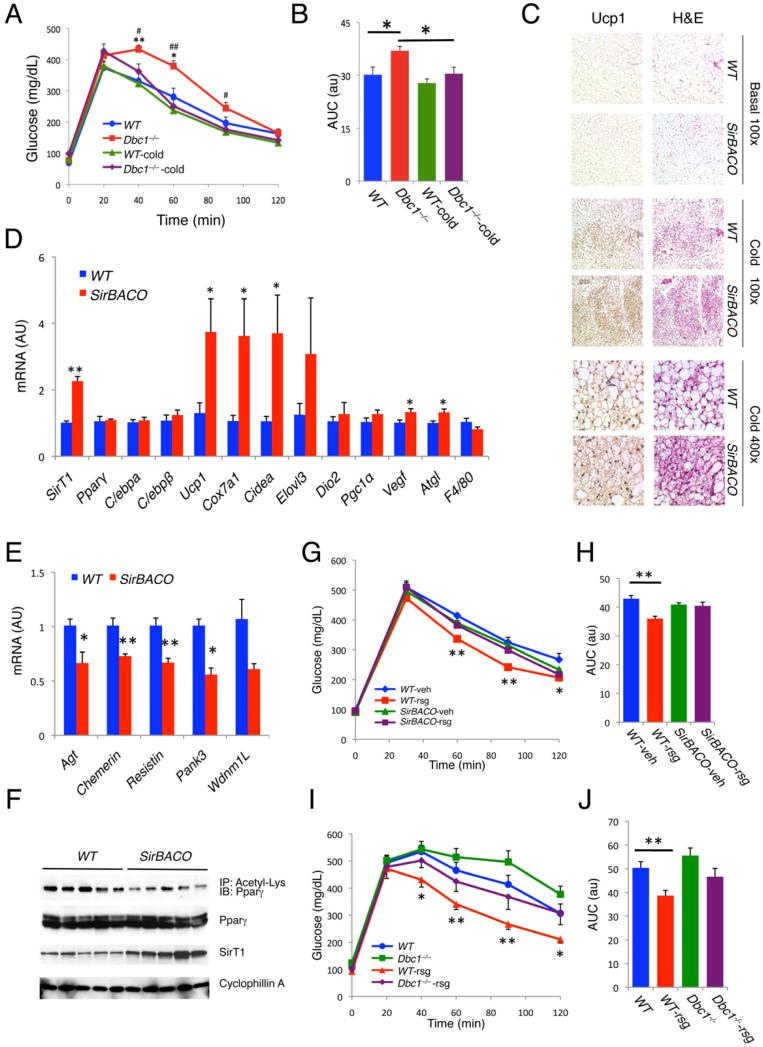
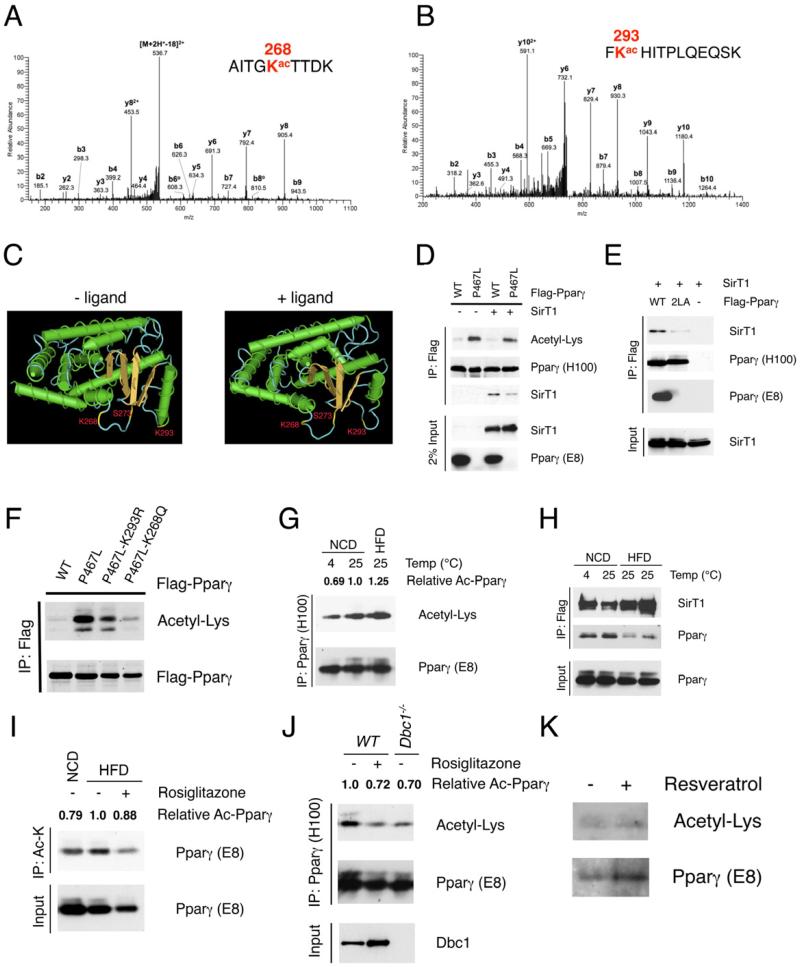
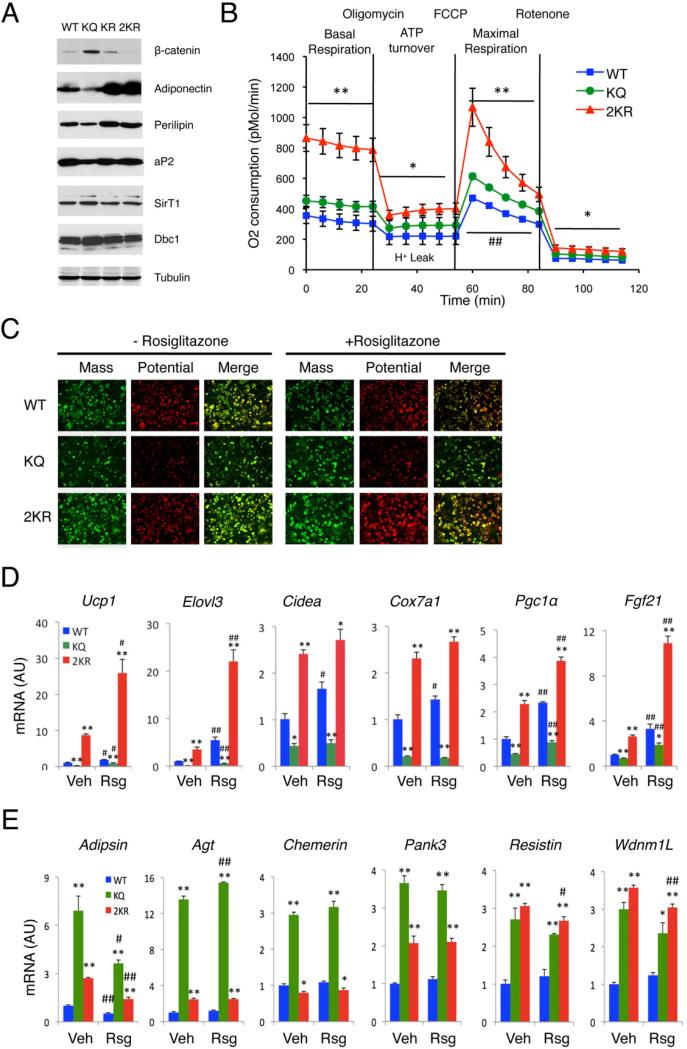
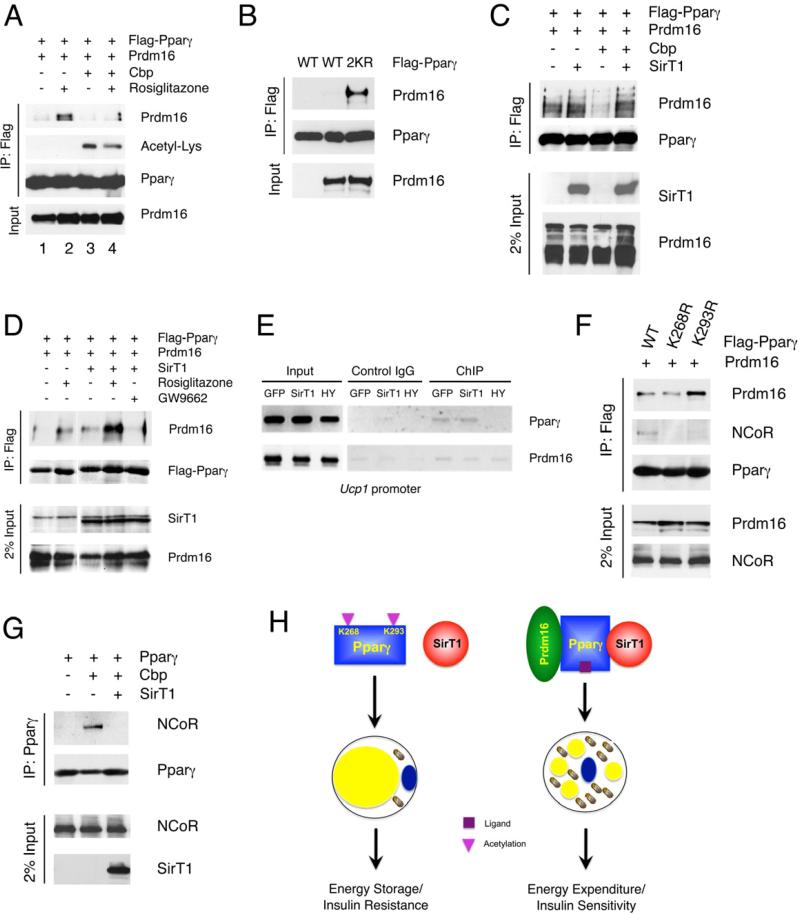
Brown adipose tissue (BAT) can disperse stored energy as heat. Promoting BAT-like features in white adipose (WAT) is an attractive, if elusive, therapeutic approach to staunch the current obesity epidemic. Here we report that gain of function of the NAD-dependent deacetylase SirT1 or loss of function of its endogenous inhibitor Deleted in breast cancer-1 (Dbc1) promote "browning" of WAT by deacetylating peroxisome proliferator-activated receptor (Ppar)-γ on Lys268 and Lys293. SirT1-dependent deacetylation of Lys268 and Lys293 is required to recruit the BAT program coactivator Prdm16 to Pparγ, leading to selective induction of BAT genes and repression of visceral WAT genes associated with insulin resistance. An acetylation-defective Pparγ mutant induces a brown phenotype in white adipocytes, whereas an acetylated mimetic fails to induce "brown" genes but retains the ability to activate "white" genes. We propose that SirT1-dependent Pparγ deacetylation is a form of selective Pparγ modulation of potential therapeutic import.


Figures

Figure 1
Figure 1. SirT1 deacetylates Pparγ in a ligand-dependent manner
(A) Co-immunoprecipitation (Co-IP) of Flag-tagged SirT1 or HA-tagged Pparγ in response to overnight rosiglitazone treatment in 293 cells. (B) Co-IP of Flag-Pparγ and SirT1 in 293 cells treated with troglitazone (Trog) or GW9662 (GW) overnight. (C) Pparγ acetylation in 293 cells in response to resveratrol. (D-E) In vitro Pparγ deacetylation by SirT1. Bovine serum albumin (BSA) is contained in the reaction buffer. (F) Co-IP of Pparγ with SirT1 in mouse adipose tissues. We immunoprecipitated 2 mg of epididymal (eWAT) or inguinal fat lysates (iWAT) with Pparγ antibody H100, and blotted the immunoprecipitates with SirT1 or Pparγ (E8) antibodies. (G) Co-IP of SirT1 and Pparγ with Flag M2 beads using iWAT (5 mg) from SirBACO mice expressing Flag-tagged SirT1. See also Figure S1.
Figure 2
Figure 2. SirT1 mimics Pparγ ligand in regulating adipocyte gene expression
(A) Expression of white genes in 3T3-L1 adipocytes treated with 50 μM resveratrol or vehicle (Veh) overnight on differentiation day 7. *: P<0.05, **: P<0.01 vs. vehicle (n=3). (B) White gene expression in 3T3-L1 adipocytes overexpressing GFP, SirT1 or Sirt1-H363Y (HY). Fully differentiated cells were harvested on day 8 of differentiation. *: P<0.05, **: P<0.01 vs. GFP (n=7). (C) Ucp1 expression in HIB-1B brown adipocytes with treatments overnight on day 6 of differentiation. **: P<0.01 vs. vehicle-treated controls (n=3-4). (D-E) Protein (D) and gene expression analysis (E) in HIB-1B cells overexpressing GFP, SirT1 and Sirt1-H363Y (HY). IP: immunoprecipitation, IB: immunoblot; *: P<0.05, **: P<0.01 vs. GFP (n=3-9). Values are presented as means ± SEM. See also Figure S2.
Figure 3
Figure 3. SirT1 gain-of-function promotes browning of subcutaneous WAT
(A) Western blots in visceral (eWAT), subcutaneous (iWAT) and brown (BAT) adipose tissues from cold-exposed 8-week-old male mice. (B) Western blotting of iWAT from chow-fed SirT1–/– mice and control littermates after overnight cold exposure. (C-G) 8-week-old, chow-fed male Dbc1–/– and SirBACO mice with their control littermates (WT) were exposed to 4°C overnight. Haemotoxylin Eosin (H&E) and Ucp1 immunohistochemical staining of adipose tissues (C), western blotting (D-E) and gene expression analysis (F-G) of iWAT. *: P<0.05, **: P<0.01 for Dbc1–/– vs. WT (n=6) or for SirBACO vs. WT (n=5). Values are presented as means ± SEM. See also Figure S3.
Figure 4
Figure 4. Metabolic correlates of SirT1-dependent Pparγ deacetylation
(A-B) Time course (A) and area under the curve (AUC) (B) of intra-peritoneal glucose tolerance tests (IPGTT) in chow-fed, 18-week-old male Dbc1–/– and WT mice before and after chronic cold exposure (12 °C for 4 weeks). Body weights are shown in Figure S4A. In Figure A *: P<0.05, **: P<0.01 for Dbc1–/– vs. WT before cold exposure; #: P<0.05, ##: P<0.01 for Dbc1–/– vs. cold-exposed Dbc1–/– mice. In Figure B, *: P<0.05. (n=6-7). (C-D) Ucp1 immunohistochemistry, H&E staining (C), and gene expression (D) in iWAT of 9-week-old male SirBACO mice after chronic cold exposure. *: P<0.05, **: P<0.01 vs. WT (n=6). (E-F) Expression of white genes (E) and Pparγ acetylation (F) in iWAT of male SirBACO mice after 8 weeks on high-fat diet (HFD). Mice were placed on HFD at 6 weeks of age. *: P<0.05, **: P<0.01 vs. WT (n=5). IP: Immunoprecipitation, IB: immunoblot. (G-H) IPGTT (G) and AUC (H) in male SirBACO mice fed with HFD for 6 weeks (starting at 12 weeks of age), and treated with rosiglitazone (rsg) or vehicle (veh) for 1 week. Body weight information is in Figure S4F. *: P<0.05, **: P<0.01 WT-rsg vs. WT-veh (n=6-8). (I-J) IPGTTs (I) and AUC (J) in male Dbc1–/– mice fed with HFD for 25 weeks before and after 1 week rosiglitazone (rsg) administration. Mice were placed on HFD at 5 weeks of age. Body weight information is in Figure S4G. *: P<0.05, **: P<0.01 for WT vs. WT-rsg (n=7). Values are presented as means ± SEM. See also Figure S4.
Figure 5
Figure 5. Identification of Pparγ Lys268 and Lys293 as SirT1 substrates
(A-B) Annotation of MS/MS spectra of acetylated peptides of Pparγ after trypsin digestion at Lys268 (A) and at Lys293 (B). (C) 3-D model of liganded and unliganded Pparγ structure generated by NIH Cn3D software, localizing Lys268, Lys293 and Ser273 within helix 2-helix 2’ region. (D) Decreased SirT1 binding and increased acetylation of Pparγ P467L mutant. Co-IP of Flag-tagged WT or P467L mutant Pparγ with SirT1 in 293 cells. Pparγ (E8) antibody fails to recognize P467L mutant. (E) Mutation of the LxxLL motif on helix 12 disrupts SirT1 binding. Co-IP of Flag-tagged WT or 2LA mutant Pparγ with SirT1 in 293 cells. (F) Mutations of Lys268 or Lys293 decrease acetylation of P467L mutant Pparγ in 293 cells. (G) Pparγ acetylation in pooled iWAT from 4-5 male mice exposed to 4 °C overnight or fed HFD for 16 weeks. We used 12 mg protein to immunoprecipitate Pparγ using antibody H100. (H) Interaction of Pparγ with SirT1 in iWAT. Pooled iWAT from 3-5 male SirBACO mice exposed to 4 °C overnight or fed HFD for 16 weeks. We used 8 mg protein as in each lane to co-IP Flag-tagged SirT1. (I) Pparγ acetylation in response to TZD following HFD. Male WT mice were fed HFD for 18 weeks and treated with rosiglitazone for 3 days. Pooled iWAT from 4 mice was lysed, and 12 mg protein was used in each lane to immunoprecipitate with acetyl-Lysine (Ac-K) antibody. (J) Pparγ acetylation in response to TZD and deletion of Dbc1. Chow-fed male WT mice were treated with rosiglitazone for 3 days. 12 mg protein from pooled iWAT of 4 mice was used for IP with Pparγ antibody (H100). (K) Pparγ acetylation in human adipose tissue in response to resveratrol. Human subcutaneous adipose fragments were treated with resveratrol (50 μM) for 12 hours. 1.2 mg protein was immunoprecipitated with Pparγ antibody (H100). We estimated relative levels of Pparγ acetylation (Ac-Pparγ) using densitometry with NIH ImageJ software. See also Figure S5.
Figure 6
Figure 6. Deacetylation of Pparγ is required for its browning function
(A) Western blots analyses of Swiss 3T3 fibroblasts expressing WT, K293R (KR), K293Q (KQ) and K268R/K293R (2KR) Pparγ on day 6 of differentiation. (B) Oxygen consumption rates (OCR) in fully differentiated cells (Day 8). *: P<0.05, **: P<0.01 for 2KR vs. WT cells; #: P<0.05, ##: P<0.01 for KQ vs. WT, n=6-7. The higher basal OCR in cells expressing the KQ mutant is likely due to increased cell number, owing to their shorter doubling time (Figure S6B). (C) Mitochondrial mass (green) and membrane potential (red) on day 8 of differentiation. (D-E) Brown gene (D) and white gene expression (E) on day 8 in cells treated with vehicle (Veh) or rosiglitazone (Rsg) overnight. *: P<0.05, **: P<0.01 vs. WT cells; #: P<0.05, ##: P<0.01 vs. untreated cells (n=3). Values are presented as means ± SEM. See also Figure S6.
Figure 7
Figure 7. Deacetylation of Pparγ modulates the coactivator/corepressor exchange
(A) Pparγ interacts with Prdm16 in a ligand- and deacetylation-dependent manner. Co-IP of Flag-tagged Pparγ with Prdm16 in 293 cells, following Cbp transfection or rosiglitazone treatment. (B) Acetylation-defective Pparγ increase binding of Prdm16. Co-IP of Flag-tagged Pparγ (WT) or 2KR mutant with Prdm16 in 293 cells. (C) SirT1 promotes Pparγ interaction with Prdm16. Co-IP of Flag-tagged Pparγ with Prdm16 following transfection of Cbp and/or SirT1 in 293 cells. (D) SirT1 mimics TZD to increase Pparγ interaction with Prdm16. Co-IP of Flag-tagged Pparγ with Prdm16 following overexpression of SirT1 and/or overnight treatments in 293 cells. (E) ChIP analysis of Pparγ and Prdm16 binding to the Ucp1 promoter in HIB-1B adipocytes expressing GFP, WT or H363Y (HY) mutant SirT1. (F) Deacetylation of Pparγ Lys268 or Lys293 inhibits binding of NCoR. Co-IP of Flag-tagged Pparγ (WT), K268R or K293R mutants with exogenous Prdm16 and endogenous NCoR in 293 cells. (G) Acetylation of Pparγ promotes binding of NCoR. Co-IP of Flag-tagged Pparγ with NCoR following transfection with SirT1 and Cbp in 293 cells. (H) Model of SirT1-dependent Pparγ deacetylation in energy homeostasis and insulin sensitivity. When nutrients are available, SirT1 is inactive and Pparγ is acetylated on Lys268 and Lys293. This condition favors lipid storage. During energy deprivation, SirT1 becomes active and is recruited to Pparγ, possibly as a result of ligand-induced conformational changes, to deacetylate Lys268 and Lys293. In white adipocytes, the deacetylated Pparγ interacts with Prdm16 to promote thermogenesis (energy expenditure) and improve insulin sensitivity. See also Figure S7.

Comment in

  • PPARγ: no SirT, no service.
    Quelle FW, Sigmund CD. Quelle FW, et al. Circ Res. 2013 Feb 1;112(3):411-4. doi: 10.1161/CIRCRESAHA.113.300870. Circ Res. 2013. PMID: 23371897 Free PMC article.

Similar articles

Cited by

References

    1. Banks AS, Kon N, Knight C, Matsumoto M, Gutierrez-Juarez R, Rossetti L, Gu W, Accili D. SirT1 gain of function increases energy efficiency and prevents diabetes in mice. Cell Metab. 2008;8:333–341. - PMC - PubMed
    1. Barroso I, Gurnell M, Crowley VE, Agostini M, Schwabe JW, Soos MA, Maslen GL, Williams TD, Lewis H, Schafer AJ, et al. Dominant negative mutations in human PPARgamma associated with severe insulin resistance, diabetes mellitus and hypertension. Nature. 1999;402:880–883. - PubMed
    1. Bartness TJ, Vaughan CH, Song CK. Sympathetic and sensory innervation of brown adipose tissue. Int J Obes (Lond) 2010;34(Suppl 1):S36–42. - PMC - PubMed
    1. Bostrom P, Wu J, Jedrychowski MP, Korde A, Ye L, Lo JC, Rasbach KA, Bostrom EA, Choi JH, Long JZ, et al. A PGC1-alpha-dependent myokine that drives brown-fat-like development of white fat and thermogenesis. Nature. 2012;481:463–468. - PMC - PubMed
    1. Canto C, Gerhart-Hines Z, Feige JN, Lagouge M, Noriega L, Milne JC, Elliott PJ, Puigserver P, Auwerx J. AMPK regulates energy expenditure by modulating NAD+ metabolism and SIRT1 activity. Nature. 2009;458:1056–1060. - PMC - PubMed

Publication types

MeSH terms