. 2012 Aug 3:13:372.
doi: 10.1186/1471-2164-13-372.

Cell-type specificity of ChIP-predicted transcription factor binding sites

Affiliations

Cell-type specificity of ChIP-predicted transcription factor binding sites

Tony Håndstad et al. BMC Genomics. .

Abstract

Background: Context-dependent transcription factor (TF) binding is one reason for differences in gene expression patterns between different cellular states. Chromatin immunoprecipitation followed by high-throughput sequencing (ChIP-seq) identifies genome-wide TF binding sites for one particular context-the cells used in the experiment. But can such ChIP-seq data predict TF binding in other cellular contexts and is it possible to distinguish context-dependent from ubiquitous TF binding?

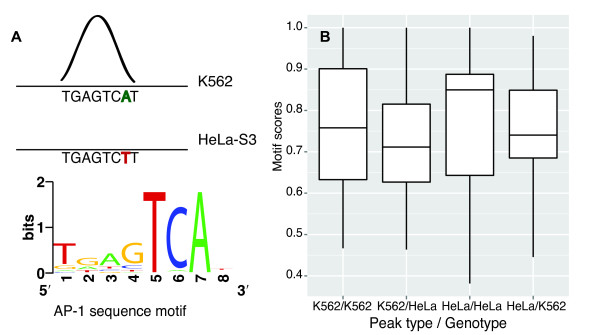
Results: We compared ChIP-seq data on TF binding for multiple TFs in two different cell types and found that on average only a third of ChIP-seq peak regions are common to both cell types. Expectedly, common peaks occur more frequently in certain genomic contexts, such as CpG-rich promoters, whereas chromatin differences characterize cell-type specific TF binding. We also find, however, that genotype differences between the cell types can explain differences in binding. Moreover, ChIP-seq signal intensity and peak clustering are the strongest predictors of common peaks. Compared with strong peaks located in regions containing peaks for multiple transcription factors, weak and isolated peaks are less common between the cell types and are less associated with data that indicate regulatory activity.

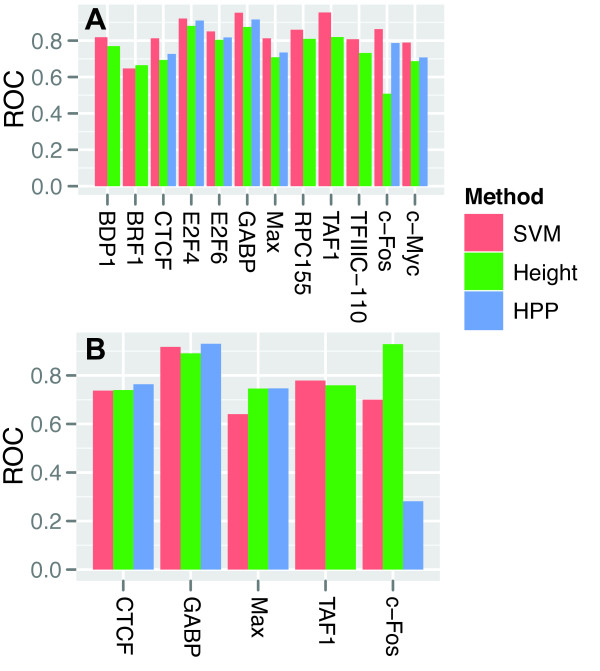
Conclusions: Together, the results suggest that experimental noise is prevalent among weak peaks, whereas strong and clustered peaks represent high-confidence binding events that often occur in other cellular contexts. Nevertheless, 30-40% of the strongest and most clustered peaks show context-dependent regulation. We show that by combining signal intensity with additional data-ranging from context independent information such as binding site conservation and position weight matrix scores to context dependent chromatin structure-we can predict whether a ChIP-seq peak is likely to be present in other cellular contexts.


Figures

Figure 1
Figure 1
Discrepancy in peak count and variable peak overlap between cell types. A) Number of ChIP-seq peak regions per TF in cell types K562 and HeLa-S3. The number of peaks varied for each TF, but there were also big differences between cell types for the same TF. B) Percentage of peaks found in promoter regions per TF in K562 and HeLa-S3. A promoter region was defined as the region 2000bp upstream and 200bp downstream of the RefSeq genes’ transcription start sites plus their first intron. On average, a third of all peaks were found in promoter regions. C) Peak overlap between K562 and HeLa-S3 relative to potential overlap; that is, the number of peak regions in K562 that overlap by at least one base pair with a peak region in HeLa-S3, divided by the lesser of the peak counts in K562 and HeLa-S3. 33% of K562 and 30% of HeLa-S3 peaks had at least one overlapping peak of the same TF in the other cell type.
Figure 2
Figure 2
Explaining regions of increased peak overlap and TF expression difference. A) Relative overlap (see Figure 1C) of peaks mapping to promoter regions compared with other peaks. Peaks in promoter regions overlap more than peaks in other genomic regions. B) Relative overlap of peaks in promoters of housekeeping genes (list from [39]) compared with peaks in other promoters. Peaks in promoters of housekeeping genes overlap more than peaks in promoters of other genes. C) Relative overlap of peaks in CpG-rich promoter regions compared with peaks in CpG-poor promoter regions. D) Alternative local binding sites. The y-axis shows the number of K562 peaks that overlap with a peak in HeLa-S3 when, one by one, each given peak region in K562 is extended by 0, 500, 1,000, 4,000 and 10,000 bp (half to each side of the peak). The number of overlaps does not increase markedly when considering larger regions surrounding the peaks. E) TF expression difference between cell types versus TF peak count difference between cell types. The x-axis gives the difference in number of ENCODE Caltech paired-end RNA-seq reads mapping to a TF gene in K562 versus HeLa-S3 (see Methods). The y-axis gives the difference in number of peaks regions in K562 vs HeLa-S3. Both differences were normalized to the range {-1, 1}. P-values for t-tests on slope of linear regression lines are shown with all TFs included (dashed line; p = 0.2) and without the expression outliers c-Fos and c-Myc (dotted line; p = 7.2∗10−3).
Figure 3
Figure 3
Higher peaks overlap more and have more consistent support in other data marking regulatory regions. Peaks in K562 for each TF (panel columns) were binned in 10 equally-sized groups with increasing peak height (ordered along x-axis) and the average values for different genomic characteristics (panel rows) were computed for each group (y-axis). From top to bottom row, the genomic characteristics are: “HeLa-S3”: percentage of peaks in K562 that overlap with a peak in HeLa-S3.; “Promoter”: percentage of peaks that overlap with promoter regions.; “CpG rich”: percentage of peaks that overlap with CpG-rich regions.; “DNase”: average count of DNase-seq reads in peak region—a measure of chromatin accessibility.; “H3K4me3”: average count of H3K4me3 ChIP-seq reads in a peak region—a measure of chromatin activity.; “phyloP”: average phyloP scores in peak region for a 28-way placental mammals multiple alignment—a measure of sequence conservation.; “PWMscore”: average maximal PWM score in peak region (where available).; “ClusterTF”: average number of peaks in peak cluster. See Methods section for definition of promoters, CpG-rich regions, and clusters and for details on other genomic data. The blue line in each panel is a linear regression line between peak height bin and genomic characteristic; the dark gray areas surrounding these lines are 95% confidence intervals; blue stars mark significant regression line slopes (p ≤0.05).
Figure 4
Figure 4
Differences in chromatin accessibility in cell-type specific peak regions suggest cell-type specific regulation. Chromatin accessibility as measured by DNase sensitivity for the two cell types in peak regions that are cell-type specific for K562 (A) and HeLa-S3 (B) and in peak regions that are common for both cell types (blue bars in A and B). Only the 30% highest peaks are analyzed. A) Box-plots showing for K562-specific TF peak regions, the distributions of DNase-seq signal in K562 (red) and HeLa-S3 (green), and for TF peak regions common to K562 and HeLa-S3, the distribution of DNase-seq signal in K562 (blue). The DNase-seq signal was the read per million-normalized number of reads mapping to each peak region divided by the region length. BRF2 has only one box-plot as all BRF2 peaks overlapped in the two cell lines. B) Similar data as in (A), but for HeLa-S3-specific peak regions the DNase-seq signal in HeLa-S3 (green) and K562 (red) and for peak regions common to K562 and HeLa-S3 the DNase-seq signal in HeLa-S3 (blue). Most of the TFs have comparable DNase-seq signals at the common peak regions in the two cell lines (compare blue bars in A and B). Moreover, most of the TFs show symmetric signals at the cell-type specific peak regions, such that the regions that are specific for K562 have higher DNase-seq signals in K562 than in HeLa-S3 (A) and vice versa (B).
Figure 5
Figure 5
Differences in H3K4me3 signal in cell-type specific peak regions suggest cell-type specific regulation. H3K4me3 enrichment for the two cell types in peak regions that are cell-type specific for K562 (A) and HeLa-S3 (B) and in peak regions that are common for both cell types (A and B). Only the 30% highest peaks are analyzed. A) Box-plots showing for K562-specific TF peak regions, the distributions of H3K4me3 ChIP-seq signal in K562 (red) and HeLa-S3 (green), and for TF peak regions common to K562 and HeLa-S3, the distribution of H3K4me3 ChIP-seq signal in K562 (blue). The H3K4me3 ChIP-seq signal was the read per million-normalized number of reads mapping to each peak region divided by the region length. BRF2 has only one box-plot as all BRF2 peaks overlapped in the two cell lines. B) Similar data as in (A), but for HeLa-S3-specific peak regions the H3K4me3 ChIP-seq signal in HeLa-S3 (green) and K562 (red) and for peak regions common to K562 and HeLa-S3 the H3K4me3 ChIP-seq signal in HeLa-S3 (blue). The H3K4me3 ChIP-seq data show the same patterns as the DNase-seq data (see Figure 4).
Figure 6
Figure 6
Genotype differences in sequence motifs can give cell-type specific peaks.A) A specific example of how different alleles can create differences in sequence motifs, possibly causing cell-type specific TF-binding. SNP rs7138374 (chr12:130,642,970) is located at the highly conserved position 7 in the highest scoring AP-1 sequence motif in a K562-specific c-Fos peak region. K562 is homozygous for the A allele (green letter) and has a peak (illustrated here by a curve; top of panel). HeLa-S3 is homozygous for the T allele (red letter), which disrupts the motif, and has no peak (illustrated by absence of curve; middle of panel). The bottom part of the panel shows the sequence logo for the AP-1 sequence motif. B) A comparison of PWM motif score distributions in K562- and HeLa-S3-specific peaks that contain SNPs in the highest-scoring sequence motif regions in the peaks, and where these SNPs are homozygous but have different alleles in the two cell types. The two leftmost box-plots compare for the K562-specific peaks that contain such homozygous SNPs, the PWM motif scores for the K562 and HeLa-S3 genotypes (K562/K562 and K562/HeLa, respectively); the two rightmost box-plots compare for the HeLa-S3-specific peaks that contain such homozygous SNPs, the motif scores for the HeLa-S3 and K562 genotypes (HeLa/HeLa and HeLa/K562, respectively). The K562-specific peaks have significantly higher motif scores for the K562 genotype (K562/K562) than for the HeLa-S3 genotype (K562/HeLa), whereas the HeLa-S3-specific peaks have significantly higher motif scores for the HeLa-S3 genotype (HeLa/HeLa) than for the K562 genotype (HeLa/K562; p = 1.9∗10−4and p = 1.1∗10−5, one-sided paired t-tests for K562- and HeLa-specific peaks, respectively).
Figure 7
Figure 7
Most important features for classification of peak cell-type specificity.A) Difference in average 10-fold crossvalidated ROC-score for each TF SVM classifier after removing all features within a feature group (see Table 1), compared to including all features. Y-axis shows the change in ROC-score after removing the corresponding feature for the given TF. Removing peak clustering or peak height gives a decrease in ROC-score for most TFs. B) As (A), but after removing confounding factors from the analysis. Specifically, only the 10% highest and 20% most clustered peaks were used, and peak height and cluster features were removed from the SVM training and test datasets. Only the five TFs that had more than 100 remaining peaks in both the overlapping and the cell-type specific datasets were considered. The importance of features varies for each TF. Distance to TSS seems to be more informative than the binary promoter feature, and removal of the cell-type specific mark for active chromatin (H3K4me3) gives the highest performance penalty overall.
Figure 8
Figure 8
Best prediction performance with all features.A) ROC-score for each TF classifier using the SVM model with all features (SVM), with peak height only (Height), and with peak height, phyloP conservation and PWM score (HPP), after 10-fold stratified cross-validation on the dataset consisting of K562 and HeLa-S3 peaks. B) ROC-score after 10-fold stratified cross-validation when training classifiers on K562 and HeLa-S3 peaks, and then testing for overlap with peaks from a third cell type, GM12878.

References

    1. Farnham P. Insights from genomic profiling of transcription factors. Nat Rev Genet. 2009;10(9):605–616. doi: 10.1038/nrg2636. - DOI - PMC - PubMed
    1. D’haeseleer P. What are DNA sequence motifs? Nat Biotech. 2006;24(4):423–425. doi: 10.1038/nbt0406-423. - DOI - PubMed
    1. Li X, Thomas S, Sabo P, Eisen M, Stamatoyannopoulos J, Biggin M. The role of chromatin accessibility in directing the widespread, overlapping patterns of Drosophila transcription factor binding. Genome Biol. 2011;12(4):R34. doi: 10.1186/gb-2011-12-4-r34. - DOI - PMC - PubMed
    1. Liu X, Lee C, Granek J, Clarke N, Lieb J. Whole-genome comparison of Leu3 binding in vitro and in vivo reveals the importance of nucleosome occupancy in target site selection. Genome Res. 2006;16(12):1517. doi: 10.1101/gr.5655606. - DOI - PMC - PubMed
    1. Daenen F, Van Roy F, De Bleser P. Low nucleosome occupancy is encoded around functional human transcription factor binding sites. BMC Genomics. 2008;9:332. doi: 10.1186/1471-2164-9-332. - DOI - PMC - PubMed

Publication types

MeSH terms

LinkOut - more resources