

Optimal unified approach for rare-variant association testing with application to small-sample case-control whole-exome sequencing studies
- PMID: 22863193
- PMCID: PMC3415556
- DOI: 10.1016/j.ajhg.2012.06.007
Optimal unified approach for rare-variant association testing with application to small-sample case-control whole-exome sequencing studies
Abstract
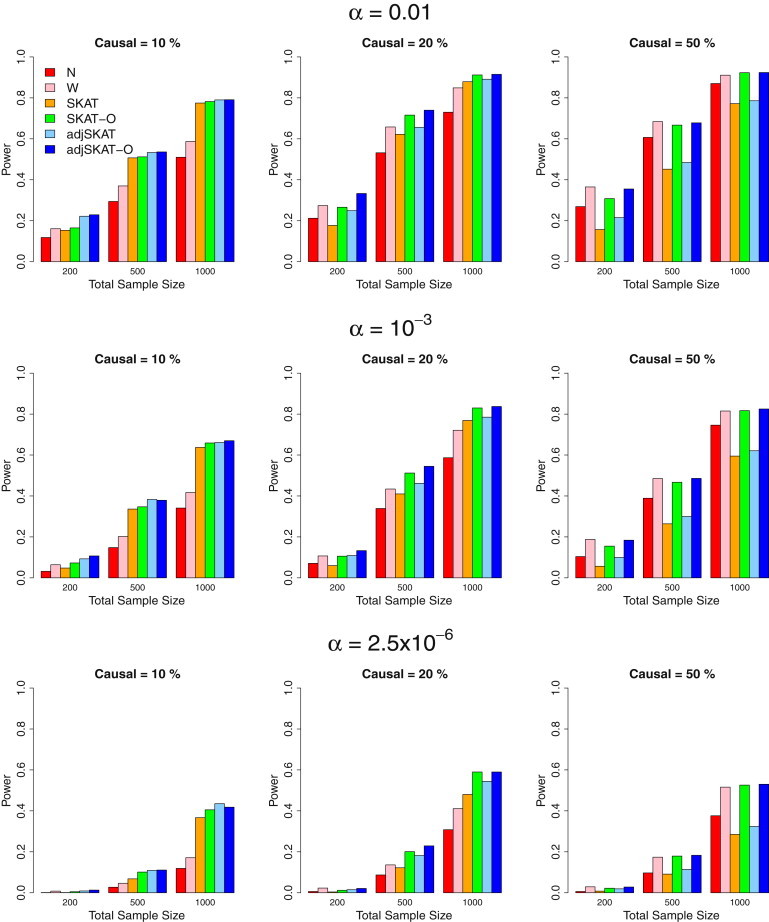
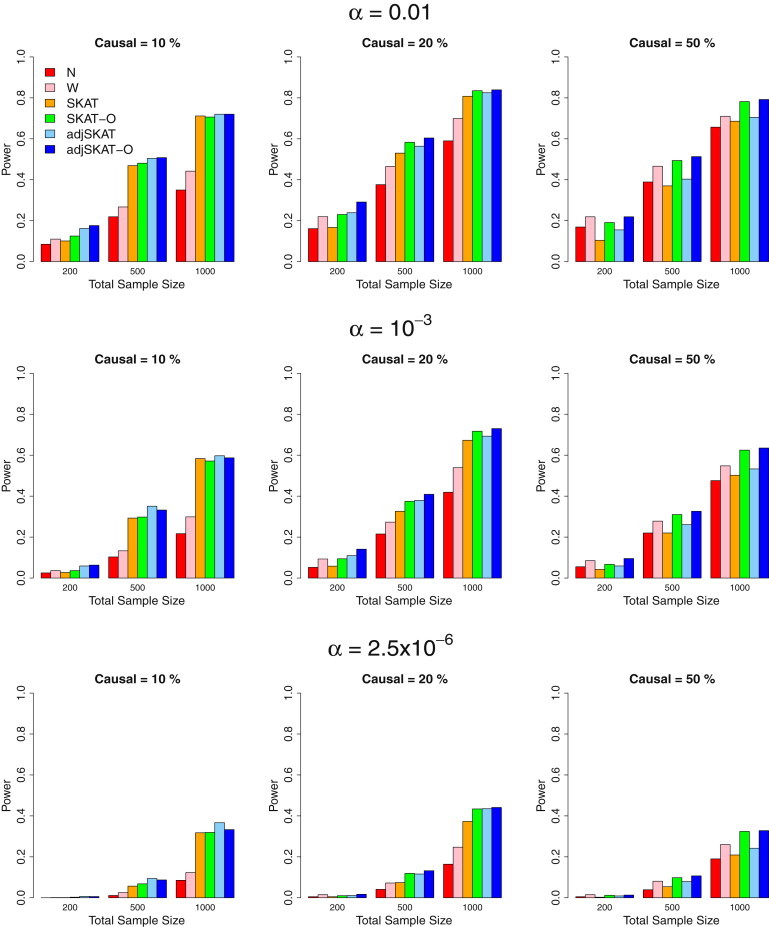
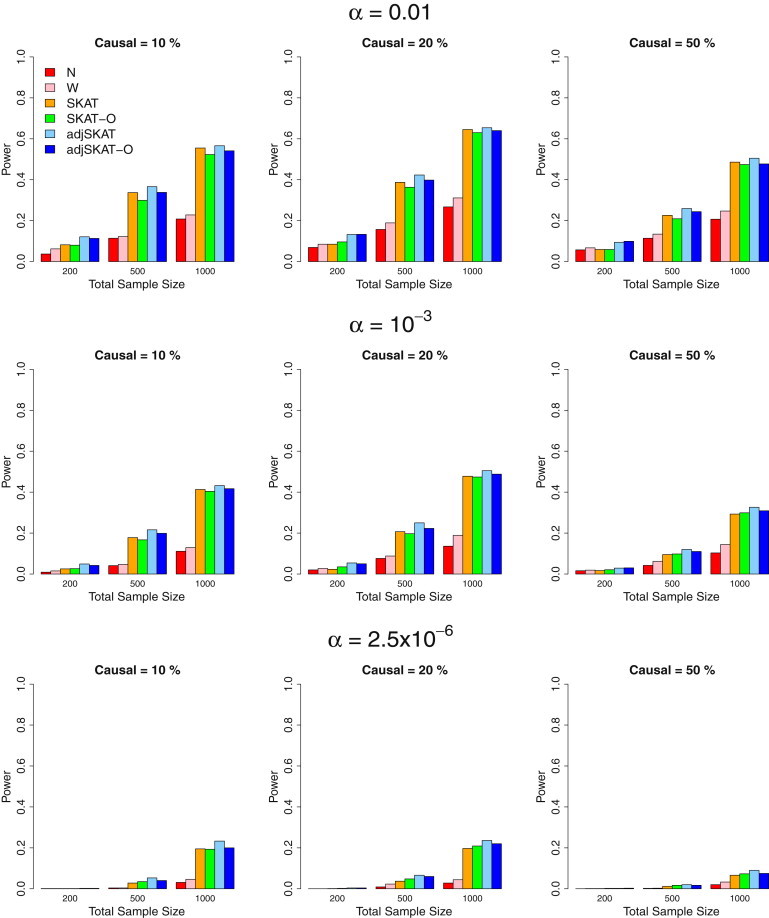
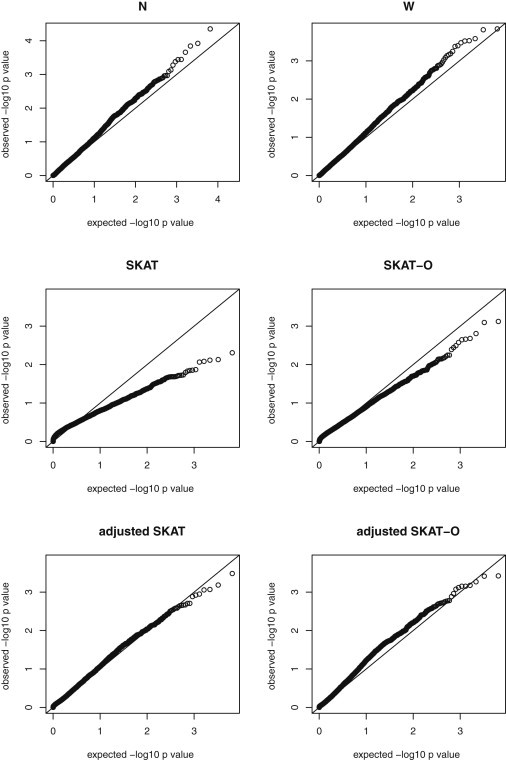
We propose in this paper a unified approach for testing the association between rare variants and phenotypes in sequencing association studies. This approach maximizes power by adaptively using the data to optimally combine the burden test and the nonburden sequence kernel association test (SKAT). Burden tests are more powerful when most variants in a region are causal and the effects are in the same direction, whereas SKAT is more powerful when a large fraction of the variants in a region are noncausal or the effects of causal variants are in different directions. The proposed unified test maintains the power in both scenarios. We show that the unified test corresponds to the optimal test in an extended family of SKAT tests, which we refer to as SKAT-O. The second goal of this paper is to develop a small-sample adjustment procedure for the proposed methods for the correction of conservative type I error rates of SKAT family tests when the trait of interest is dichotomous and the sample size is small. Both small-sample-adjusted SKAT and the optimal unified test (SKAT-O) are computationally efficient and can easily be applied to genome-wide sequencing association studies. We evaluate the finite sample performance of the proposed methods using extensive simulation studies and illustrate their application using the acute-lung-injury exome-sequencing data of the National Heart, Lung, and Blood Institute Exome Sequencing Project.
Copyright © 2012 The American Society of Human Genetics. Published by Elsevier Inc. All rights reserved.
Figures
References
-
- Shendure J., Ji H. Next-generation DNA sequencing. Nat. Biotechnol. 2008;26:1135–1145. - PubMed
-
- Mardis E.R. Next-generation DNA sequencing methods. Annu. Rev. Genomics Hum. Genet. 2008;9:387–402. - PubMed
-
- Cohen J.C., Kiss R.S., Pertsemlidis A., Marcel Y.L., McPherson R., Hobbs H.H. Multiple rare alleles contribute to low plasma levels of HDL cholesterol. Science. 2004;305:869–872. - PubMed
Publication types
MeSH terms
Grants and funding
- RC2 HL102923/HL/NHLBI NIH HHS/United States
- R37 CA076404/CA/NCI NIH HHS/United States
- RC2 HL102926/HL/NHLBI NIH HHS/United States
- P30 ES000002/ES/NIEHS NIH HHS/United States
- RC2 HL-102923/HL/NHLBI NIH HHS/United States
- UC2 HL102923/HL/NHLBI NIH HHS/United States
- RC2 HL-102925/HL/NHLBI NIH HHS/United States
- UC2HL102923/HL/NHLBI NIH HHS/United States
- R35 CA197449/CA/NCI NIH HHS/United States
- R01HL060710/HL/NHLBI NIH HHS/United States
- RC2 HL101779/HL/NHLBI NIH HHS/United States
- R01 HL060710/HL/NHLBI NIH HHS/United States
- RC2 HL-102926/HL/NHLBI NIH HHS/United States
- RC2 HL-102924/HL/NHLBI NIH HHS/United States
- RC2 HL102924/HL/NHLBI NIH HHS/United States
- RC2 HL103010/HL/NHLBI NIH HHS/United States
- P01 CA134294/CA/NCI NIH HHS/United States
- RC2 HL-103010/HL/NHLBI NIH HHS/United States
- RC2 HL102925/HL/NHLBI NIH HHS/United States
LinkOut - more resources
Full Text Sources
Other Literature Sources
Medical
Molecular Biology Databases
