

Evolving concepts on adjusting human resting energy expenditure measurements for body size
- PMID: 22863371
- PMCID: PMC3477241
- DOI: 10.1111/j.1467-789X.2012.01019.x
Evolving concepts on adjusting human resting energy expenditure measurements for body size
Abstract
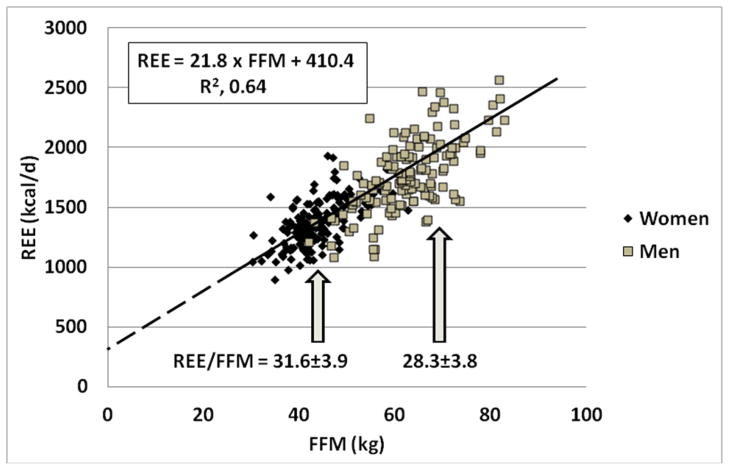
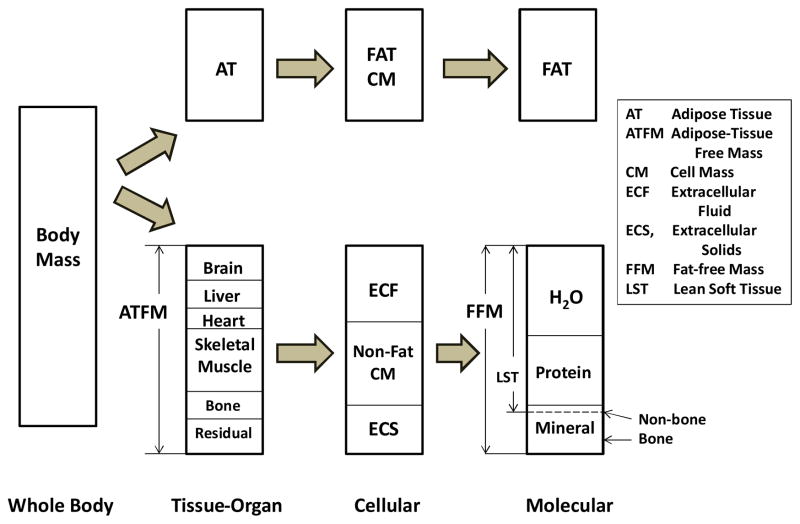
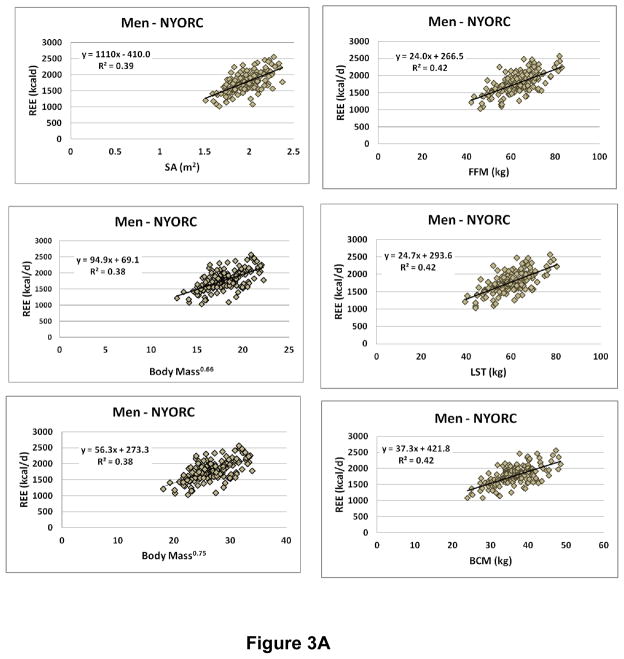
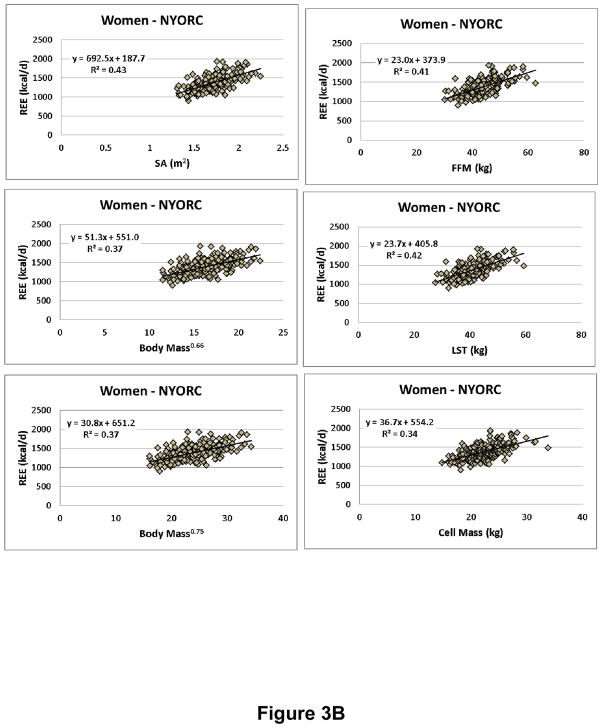
Establishing if an adult's resting energy expenditure (REE) is high or low for their body size is a pervasive question in nutrition research. Early workers applied body mass and height as size measures and formulated the Surface Law and Kleiber's Law, although each has limitations when adjusting REE. Body composition methods introduced during the mid-20th century provided a new opportunity to identify metabolically homogeneous 'active' compartments. These compartments all show improved correlations with REE estimates over body mass-height approaches, but collectively share a common limitation: REE-body composition ratios are not 'constant' but vary across men and women and with race, age and body size. The now-accepted alternative to ratio-based norms is to adjust for predictors by applying regression models to calculate 'residuals' that establish if an REE is relatively high or low. The distinguishing feature of statistical REE-body composition models is a 'non-zero' intercept of unknown origin. The recent introduction of imaging methods has allowed development of physiological tissue-organ-based REE prediction models. Herein, we apply these imaging methods to provide a mechanistic explanation, supported by experimental data, for the non-zero intercept phenomenon and, in that context, propose future research directions for establishing between-subject differences in relative energy metabolism.
© 2012 The Authors. obesity reviews © 2012 International Association for the Study of Obesity.
Conflict of interest statement
Figures
References
-
- Bogardus C, Lillioja S, Ravussin E, et al. Familial dependence of the resting metabolic rate. N Engl J Med. 1986;315:96–100. - PubMed
-
- Ravussin E, Lillioja S, Knowler WC, et al. Reduced rate of energy expenditure as a risk factor for body-weight gain. N Engl J Med. 1988;318:467–72. - PubMed
-
- Ravussin E, Bogardus C. Relationship of genetics, age, and physical fitness to daily energy expenditure and fuel utilization. Am J Clin Nutr. 1989;49:968–75. - PubMed
-
- Harris JA, Benedict FG. A biometric study of basal metabolism in man. Carnegie Institution of Washington; 1919.
-
- Kleiber M. Huntington, N.Y: R. E. Krieger Pub. Co; 1975. The fire of life: an introduction to animal energetics. Rev. edn.
Publication types
MeSH terms
Grants and funding
LinkOut - more resources
Full Text Sources
