Comparative Study
. 2012 Aug 3:12:131.
doi: 10.1186/1471-2229-12-131.

Comparison of freezing tolerance, compatible solutes and polyamines in geographically diverse collections of Thellungiella sp. and Arabidopsis thaliana accessions

Affiliations
Comparative Study

Comparison of freezing tolerance, compatible solutes and polyamines in geographically diverse collections of Thellungiella sp. and Arabidopsis thaliana accessions

Yang Ping Lee et al. BMC Plant Biol. .

Abstract

Background: Thellungiella has been proposed as an extremophile alternative to Arabidopsis to investigate environmental stress tolerance. However, Arabidopsis accessions show large natural variation in their freezing tolerance and here the tolerance ranges of collections of accessions in the two species were compared.

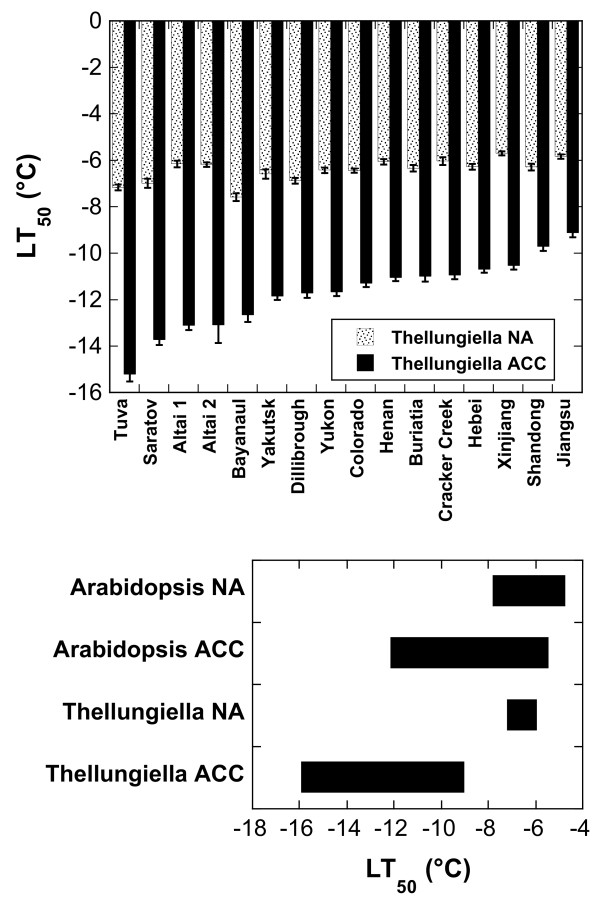
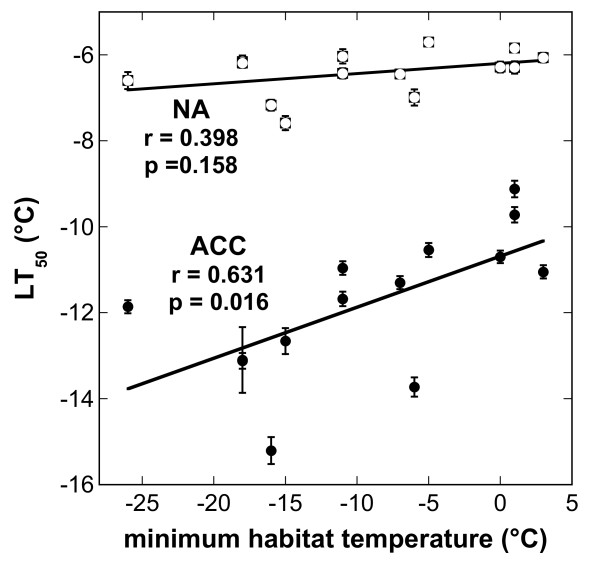
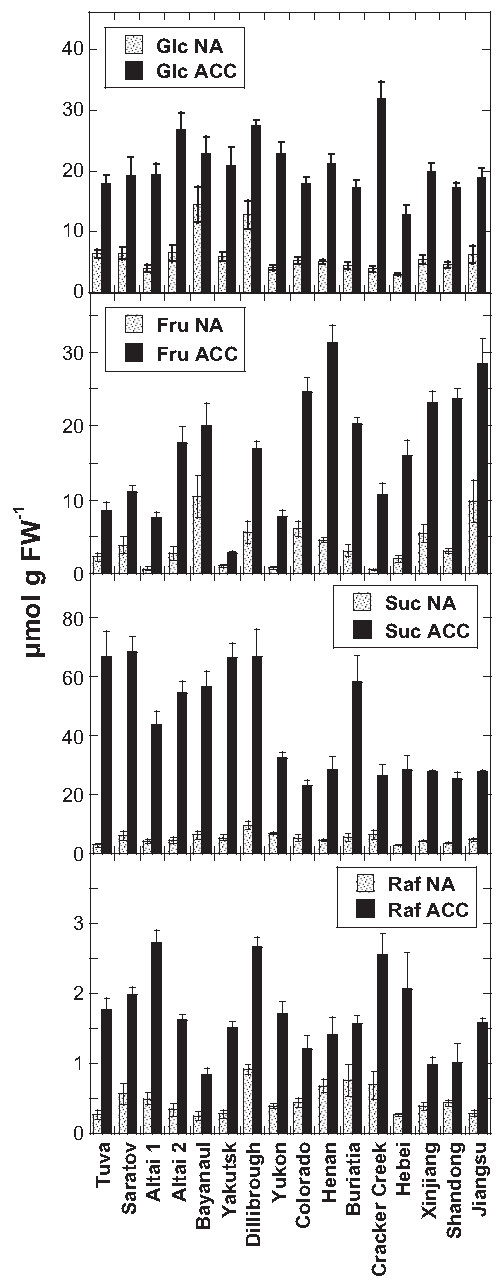
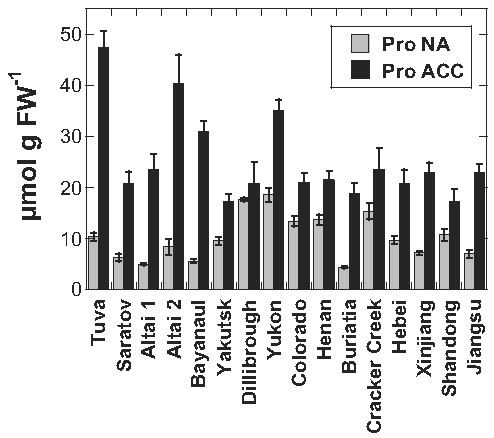
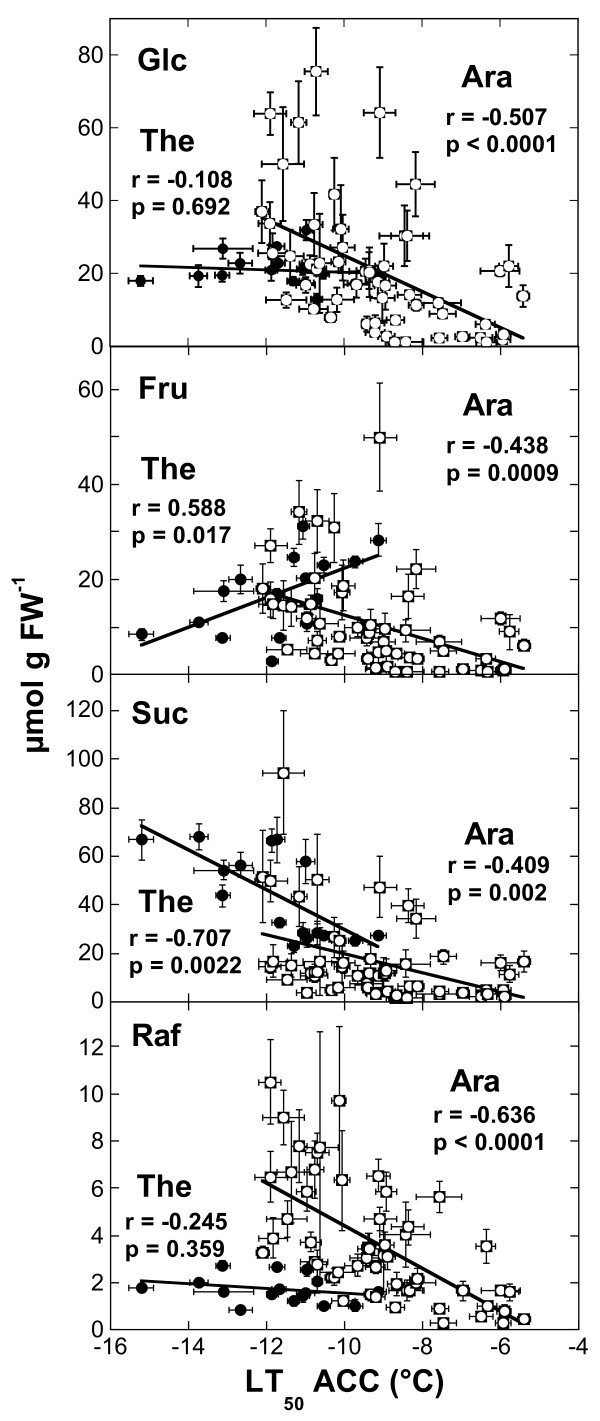
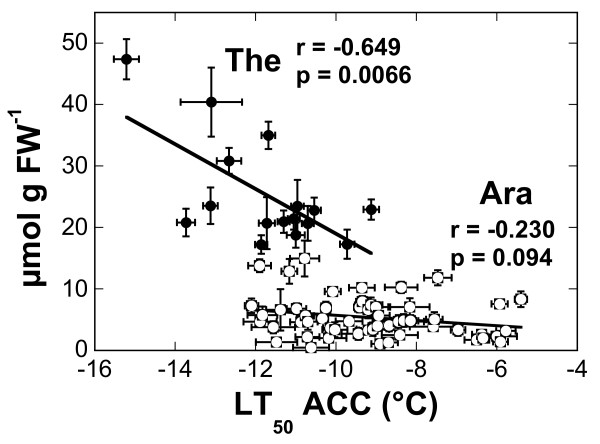
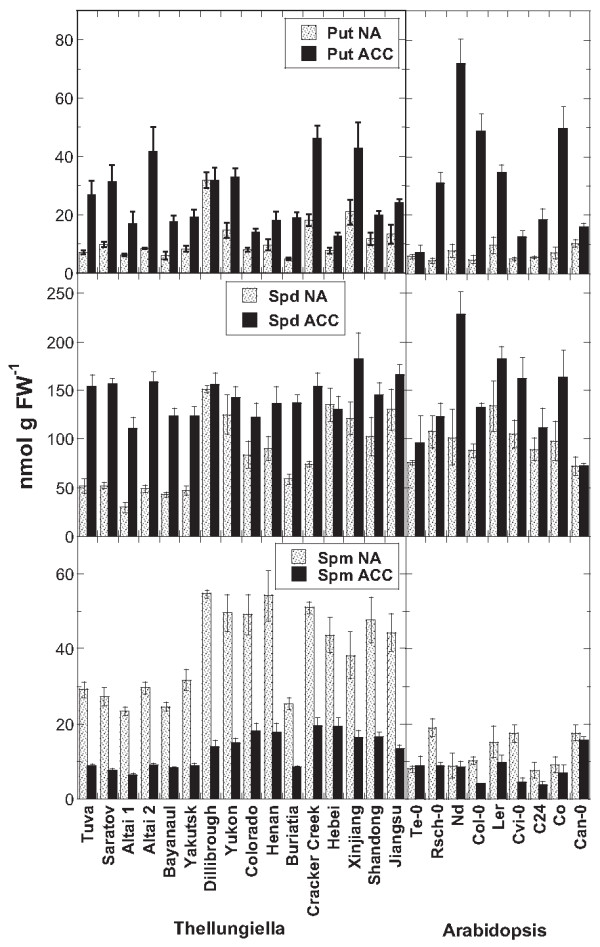
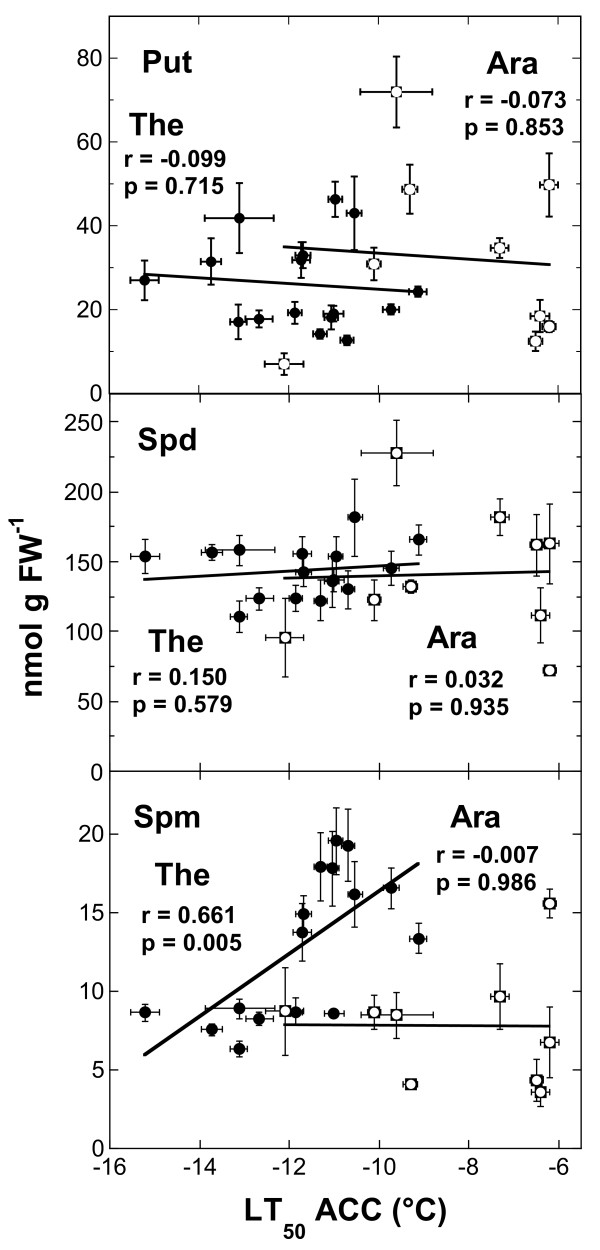
Results: Leaf freezing tolerance of 16 Thellungiella accessions was assessed with an electrolyte leakage assay before and after 14 days of cold acclimation at 4°C. Soluble sugars (glucose, fructose, sucrose, raffinose) and free polyamines (putrescine, spermidine, spermine) were quantified by HPLC, proline photometrically. The ranges in nonacclimated freezing tolerance completely overlapped between Arabidopsis and Thellungiella. After cold acclimation, some Thellungiella accessions were more freezing tolerant than any Arabidopsis accessions. Acclimated freezing tolerance was correlated with sucrose levels in both species, but raffinose accumulation was lower in Thellungiella and only correlated with freezing tolerance in Arabidopsis. The reverse was true for leaf proline contents. Polyamine levels were generally similar between the species. Only spermine content was higher in nonacclimated Thellungiella plants, but decreased during acclimation and was negatively correlated with freezing tolerance.

Conclusion: Thellungiella is not an extremophile with regard to freezing tolerance, but some accessions significantly expand the range present in Arabidopsis. The metabolite data indicate different metabolic adaptation strategies between the species.


Figures

Figure 1
Figure 1
Freezing tolerance of leaves from 16Thellungiellaaccessions before (NA) and after (ACC) 14 days of cold acclimation at 4°C. Freezing tolerance was measured with an electrolyte leakage assay and is expressed as the LT50, i.e. the temperature that resulted in 50% ion leakage from the leaves. All accessions and information on their geographical origins are listed in Table 1. The bars in the top panel represent the means ± SE from five replicate measurements where each replicate comprised leaves from three plants. The accessions are ordered from the lowest LT50 after cold acclimation on the left to the highest on the right. The bottom panel shows the range of LT50 values before and after cold acclimation for 54 Arabidopsis accessions [13] and the 16 Thellungiella accessions investigated in the present study.
Figure 2
Figure 2
Correlation between the average minimum habitat temperature recorded during the coldest month of the growth season (Table1) and the LT50of the leaves from either nonacclimated (NA) or cold acclimated plants (ACC). The lines were fitted to the data by linear regression analysis and the correlation coefficients and p-values are shown in the figure.
Figure 3
Figure 3
Contents of soluble sugars in the leaves of all investigatedThellungiellaaccessions. Leaves were harvested either before (NA) or after (ACC) cold acclimation. Note the different scales of the ordinates in the different panels. The accessions are ordered from the lowest LT50 after cold acclimation on the left to the highest on the right. The bars represent means ± SE from measurements of seven to 10 samples from two independent experiments.
Figure 4
Figure 4
Proline contents in the leaves of all investigatedThellungiellaaccessions. Leaves were harvested either before (NA) or after (ACC) cold acclimation. The accessions are ordered from the lowest LT50 after cold acclimation on the left to the highest on the right. The bars represent means ± SE from measurements of nine or 10 samples from two independent experiments.
Figure 5
Figure 5
Correlations among the contents of different soluble sugars inArabidopsisandThellungiellaand their freezing tolerance after cold acclimation. The lines were fitted to the data by linear regression analysis and the correlation coefficients and p-values are shown in the panels. The data for Thellungiella (solid symbols) are the same as those shown in Fig. 1 for LT50 and in Fig. 3 for sugar contents. The data for Arabidopsis (open symbols) are taken from [13].
Figure 6
Figure 6
Correlations between the proline content ofArabidopsisandThellungiellaleaves and their freezing tolerance after cold acclimation. The lines were fitted to the data by linear regression analysis and the correlation coefficients and p-values are shown in the panels. The data for Thellungiella (solid symbols) are the same as those shown in Fig. 1 for LT50 and in Fig. 4 for proline content. The data for Arabidopsis (open symbols) are taken from [13].
Figure 7
Figure 7
Contents of soluble polyamines in the leaves of all investigatedThellungiellaand nineArabidopsisaccessions. Leaves were harvested either before (NA) or after (ACC) cold acclimation. Note the different scales of the ordinates in the different panels. The accessions are ordered from the lowest LT50 after cold acclimation on the left to the highest on the right separately for Thellungiella and Arabidopsis. The bars represent means ± SE from measurements of eight to 10 samples from two independent experiments for Thellungiella and three samples from one experiment for Arabidopsis.
Figure 8
Figure 8
Correlations among the contents of different soluble polyamines in theThellungiellaandArabidopsisaccessions and their freezing tolerance after cold acclimation. The lines were fitted to the data by linear regression analysis and the correlation coefficients and p-values are shown in the panels. Solid symbols denote data from Thellungiella, open symbols data from Arabidopsis.

Similar articles

Cited by

References

    1. Guy CL, Kaplan F, Kopka J, Selbig J, Hincha DK. Metabolomics of temperature stress. Physiol Plant. 2008;132:220–235. - PubMed
    1. Smallwood M, Bowles DJ. Plants in a cold climate. Phil Trans R Soc Lond B. 2002;357:831–847. - PMC - PubMed
    1. Xin Z, Browse J. Cold comfort farm: the acclimation of plants to freezing temperatures. Plant Cell Environ. 2000;23:893–902.
    1. de Meaux J, Koornneef M. The cause and consequences of natural variation: the genomic era takes off! Curr Opin Plant Biol. 2008;11:99–102. - PubMed
    1. Koornneef M, Alonso-Blanco C, Vreugdenhil D. Naturally occurring genetic variation in Arabidopsis thaliana. Annu Rev Plant Biol. 2004;55:141–172. - PubMed

Publication types

LinkOut - more resources