. 2012 Aug 3:9:143.
doi: 10.1186/1743-422X-9-143.

Free fatty acids induce ER stress and block antiviral activity of interferon alpha against hepatitis C virus in cell culture

Affiliations

Free fatty acids induce ER stress and block antiviral activity of interferon alpha against hepatitis C virus in cell culture

Feyza Gunduz et al. Virol J. .

Abstract

Background: Hepatic steatosis is recognized as a major risk factor for liver disease progression and impaired response to interferon based therapy in chronic hepatitis C (CHC) patients. The mechanism of response to interferon-alpha (IFN-α) therapy under the condition of hepatic steatosis is unexplored. We investigated the effect of hepatocellular steatosis on hepatitis C virus (HCV) replication and IFN-α antiviral response in a cell culture model.

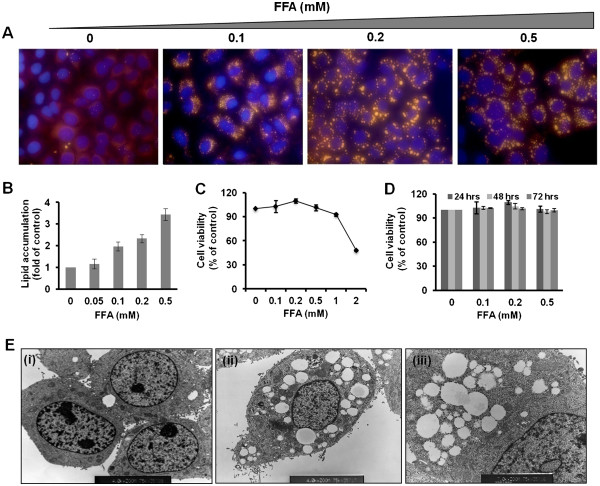
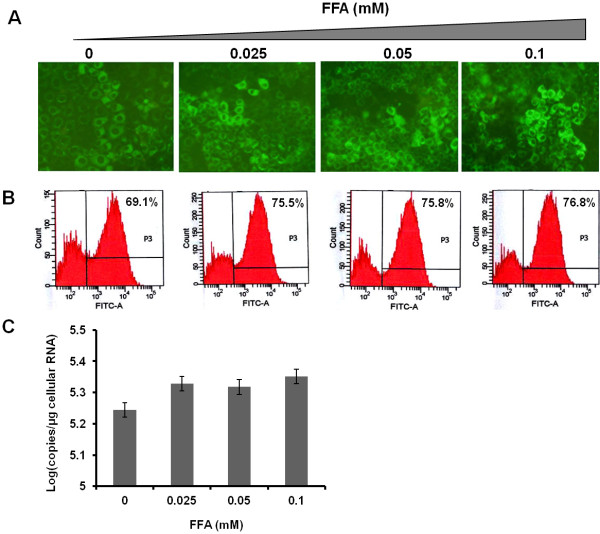
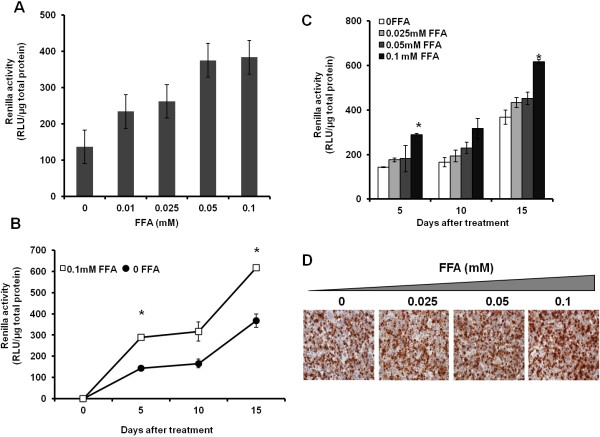
Methods: Sub-genomic replicon (S3-GFP) and HCV infected Huh-7.5 cells were cultured with a mixture of saturated (palmitate) and unsaturated (oleate) long-chain free fatty acids (FFA). Intracytoplasmic fat accumulation in these cells was visualized by Nile red staining and electron microscopy then quantified by microfluorometry. The effect of FFA treatment on HCV replication and IFN-α antiviral response was measured by flow cytometric analysis, Renilla luciferase activity, and real-time RT-PCR.

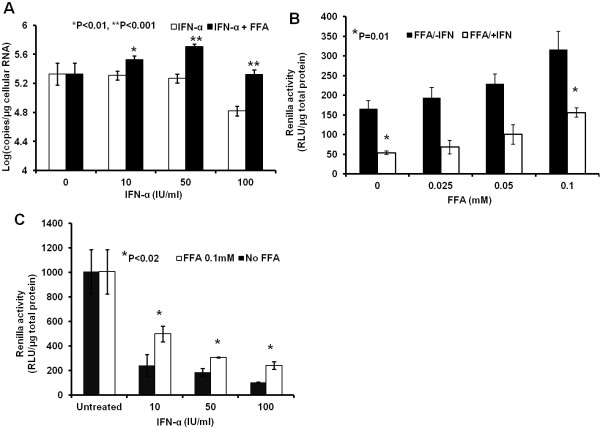
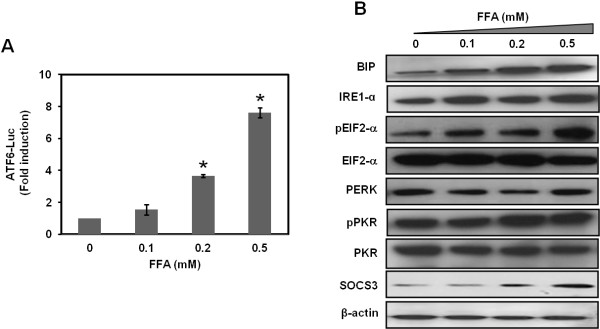
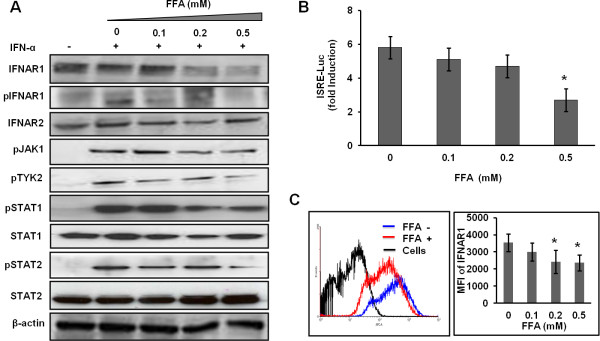
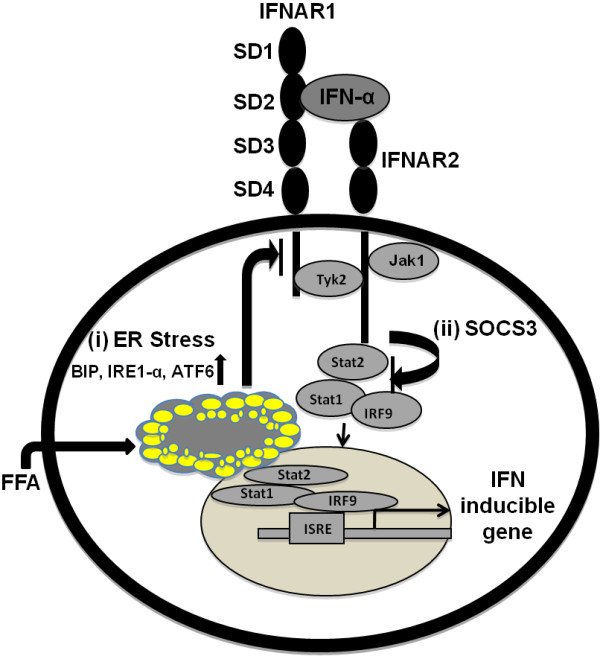
Results: FFA treatment induced dose dependent hepatocellular steatosis and lipid droplet accumulation in the HCV replicon cells was confirmed by Nile red staining, microfluorometry, and by electron microscopy. Intracellular fat accumulation supports replication more in the persistently HCV infected culture than in the sub-genomic replicon (S3-GFP) cell line. FFA treatment also partially blocked IFN-α response and viral clearance by reducing the phosphorylation of Stat1 and Stat2 dependent IFN-β promoter activation. We show that FFA treatment induces endoplasmic reticulum (ER) stress response and down regulates the IFNAR1 chain of the type I IFN receptor leading to defective Jak-Stat signaling and impaired antiviral response.

Conclusion: These results suggest that intracellular fat accumulation in HCV cell culture induces ER stress, defective Jak-Stat signaling, and attenuates the antiviral response, thus providing an explanation to the clinical observation regarding how hepatocellular steatosis influences IFN-α response in CHC.


Figures

Figure 1
Figure 1
FFA treatment induces hepatocellular steatosis in HCV replicon cells. S3-GFP cells in culture were treated with increasing concentrations of Oleate/Palmitate (2: 1 ratio) and hepatocellular steatosis due to an intracellular fat accumulation was characterized by a number of methods. (A) Fluorescence microscopy showing concentration dependent hepatocellular steatosis in S3-GFP cells 24 h post treatment by Nile Red staining (yellow) and nuclear staining (blue). The images were taken at 40× magnifications. (B) Microfluorometer analysis of intracellular fat accumulation in S3-GFP cells 24 h after FFA treatment. The values are expressed as fold change compared to untreated cells, *P <0.001, Student t test. (C) MTT assay showing the effect of intracellular fat accumulation (dose-dependent) on cellular cytotoxicity of S3-GFP cells in culture. Cell viability was expressed as % of untreated. (D) MTT assay showing cell viability over time (h) for concentrations of FFA up to 0.5 mM. (E) Electron micrograph of FFA-treated (0.5 mM) S3-GFP cells showing intracellular lipid droplet accumulation. (i) Untreated cells, (ii) FFA-treated cells, 4000×magnification, and (iii) 7000× magnification showing fat droplets in the endoplasmic reticulum (ER) (black arrow).
Figure 2
Figure 2
Effect of hepatocellular steatosis on HCV RNA replication in S3-GFP replicon cell line. S3-GFP replicon cells were cultured with different concentrations of FFA in 1% BSA for 5 days. Untreated cells received only 1% BSA. (A) The HCV-GFP expression was measured by using fluorescence microscopy. (B). Quantification of GFP expression of S3-GFP in replicon cells by flow analysis. The number indicates the mean fluorescence of GFP-positive cells. (C). Intracellular HCV RNA levels in S3-GFP replicon cells were measured by real time RT-PCR.
Figure 3
Figure 3
Effect of hepatocellular steatosis on HCV RNA replication in the infected Huh 7.5 cells. Huh-7.5 cells were infected overnight with HCV chimeric virus encoding Renilla luciferase (pJFH-ΔV3-Rluc). Infected Huh-7.5 cells were cultured long-term in growth media by splitting at a 1:10 ratio at five days intervals. (A). HCV-Renilla luciferase activity of infected Huh-7.5 cells cultured in the presence FFA for 72 hrs. The values in the y-axis represent the normalized Renilla luciferase values per one μg of total protein. The X-axis shows the different concentrations of FFA. (B). Effect of long-term culture FFA on HCV replication. HCV infected cells were cultured in the presence of 100 μM of FFA for 5, 10 and 15 days, the level of HCV RNA was measured by luciferase assay. The statistical significance was determined by paired T-test, the stars indicate a p value <0.05. (C). HCV infected cells were cultured in the presence of 100 μM concentrations of FFA for 5, 10 and 15 days. HCV replication was measured by luciferase assay. The statistical significance was determined by paired T-test, the stars indicate a p value <0.05. (D) Immunohistochemical staining for HCV core antigen in the infected Huh 7.5 cells in the presence of different concentrations of FAA after 15 days.
Figure 4
Figure 4
FFA treatment blocks the antiviral response of IFN-α against HCV. S3-GFP and infected Huh-7.5 cells were cultured with FFA for 5 days and then treated with IFN-α for 72 hours. (A) The antiviral effect of IFN-α with and without FFA treatment measured by real-time RT-PCR in S3-GFP replicon cells. *P < 0.01, **P < 0.001 , Student t test. (B) Renilla luciferse activity showing the antiviral effect of IFN-α in the infected Huh-7.5 cells co-cultured with increasing concentration of FFA. The values are normalized with total protein. (C) Luciferase activity showing the dose dependent antiviral effect of IFN-α blocked by FFA treatment (100 μM) in the infected Huh-7.5 cells. The values in the y-axis represent the values (RLU) normalized per μg of protein lysates. The values in the x-axis represent the different concentrations of IFN-α (IU/ml).
Figure 5
Figure 5
FFA treatment induces an ER stress response in S3-GFP replicon cells. (A) ATF-6 firefly luciferase activity was measured in S3-GFP cells treated with different concentrations of FFA for 24 h. 24 h post transfection, luciferase activity was measured and values are expressed as fold induction of control. *P < 0.05, Student t test. (B) Western blot analysis showing that different concentration of FFA induces BIP, IRE1-α, phospho PKR, phospho eIF2α, and SOCS3 in S3-GFP replicons. β-actin levels were used as loading controls.
Figure 6
Figure 6
FFA treatment of S3-GFP replicon cell culture blocks IFN-α induced Jak-Stat signaling. (A) Western blot analysis of Jak-Stat signaling proteins were done in S3-GFP cells cultured with different concentration of FFA for 24 h and then treated with 1000 IU/mL IFN-α for 30 minutes. β-actin levels were used as loading controls. (B) FFA treatment blocks IFN-α-induced ISRE-firefly luciferase activity. S3-GFP cells were transfected with 1 μg of pISRE-luciferase plasmid and then cultured with FFA for 24 h. Cells were then treated with 1000 IU/mL IFN-α. 24 h post-transfection, IFN-β promoter activity in the presence and absence of FFA treatment was measured. *P < 0.05 (1 tail), Student t test. (C) Flow cytometric analysis of IFNAR1 expression in Huh-7 cells treated with or without FFA. The left panel shows a histogram of IFNAR1 expression with FFA (0.5 mM) treatment for 24 h shifted to the left (red line). The right panel shows the mean fluorescence intensity (MFI) of the IFNAR1 signal. The flow cytometry plot is representative of three separate experiments, while the MFI values shown are an average (±SD) of these experiments.
Figure 7
Figure 7
Schematic representation showing that intracellular lipid droplet accumulation affects Jak-Stat signaling by two possible mechanisms. (i) Intracellular fat accumulation induces the ER stress related proteins ATF-6, BIP, IRE1-α, and this causes phophorylation of eIF2 α which leads to the down regulation of IFNAR1 expression. The reduced expression of IFNAR1 affects IFN-α binding, Jak-Stat signaling, and downstream antiviral responses. IFN-α binds to its cell surface receptor that activates Jak1 and Tyk2 phosphorylation. The activation of Jak1 and Tyk2 is required for the Stat1 and Stat2 phosphorylation. pStat1 and pStat2 bind to IRF9 to form a complex that translocates to the nucleus to induce IFN-stimulated gene expression. (ii) We show here that FFA treatment induces SOCS3 that also inhibits the phosphorylation of Stat1 and Stat2.

Similar articles

Cited by

References

    1. El-Serag HB. Hepatocellular carcinoma: recent trends in the United States. Gastroenterology. 2004;127:27–34. doi: 10.1053/j.gastro.2004.09.013. - DOI - PubMed
    1. Shepard CW, Finelli L, Alter MJ. Global epidemiology of hepatitis C virus infection. Lancet Infect Dis. 2006;5:558–567. - PubMed
    1. Deuffic S, Poynard T, Valleron AJ. Correlation between hepatitis C virus prevalence and hepatocellular carcinoma mortality in Europe. J Viral Hepat. 1999;6:411–413. doi: 10.1046/j.1365-2893.1999.00178.x. - DOI - PubMed
    1. Ghany MG, Strader DB, Thomas DL, Seeff LB. Diagnosis, management and treatment of hepatitis C: an update. Hepatology. 2009;49:1335–1374. doi: 10.1002/hep.22759. - DOI - PMC - PubMed
    1. Gao B, Hong F, Radaeva S. Host factors and failure of interferon alpha treatment in hepatitis C virus. Hepatology. 2004;39:880–890. doi: 10.1002/hep.20139. - DOI - PubMed

Publication types

MeSH terms