. 2012 Sep 7;11(3):359-72.
doi: 10.1016/j.stem.2012.05.024. Epub 2012 Aug 2.

Gene sets identified with oncogene cooperativity analysis regulate in vivo growth and survival of leukemia stem cells

Affiliations

Gene sets identified with oncogene cooperativity analysis regulate in vivo growth and survival of leukemia stem cells

John M Ashton et al. Cell Stem Cell. .

Abstract

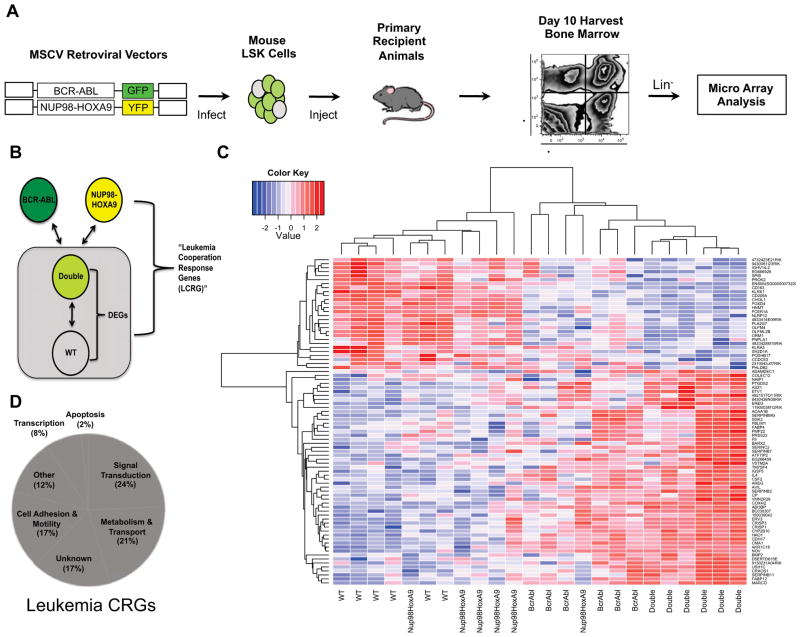
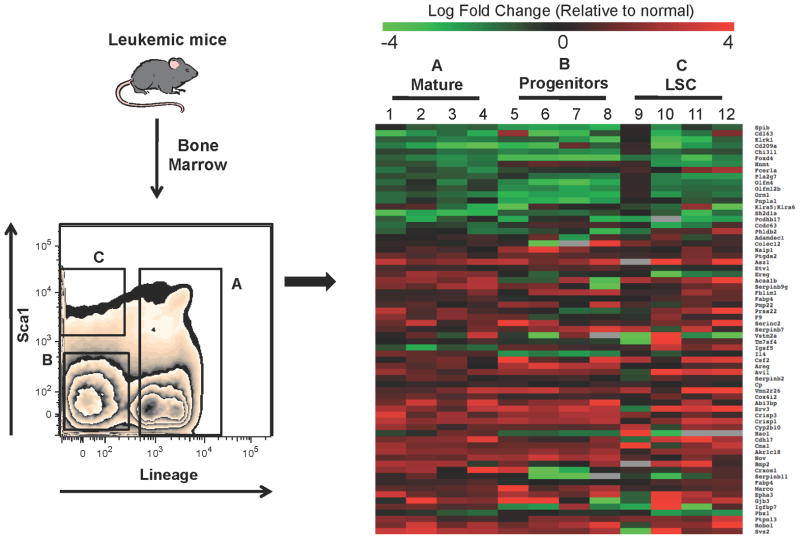
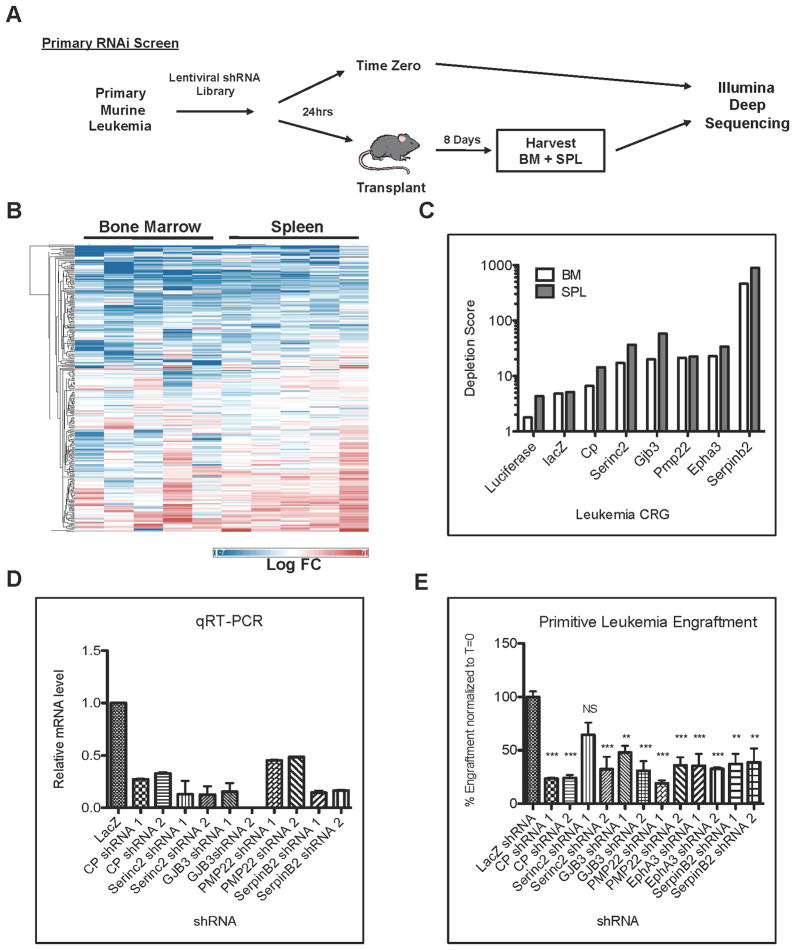
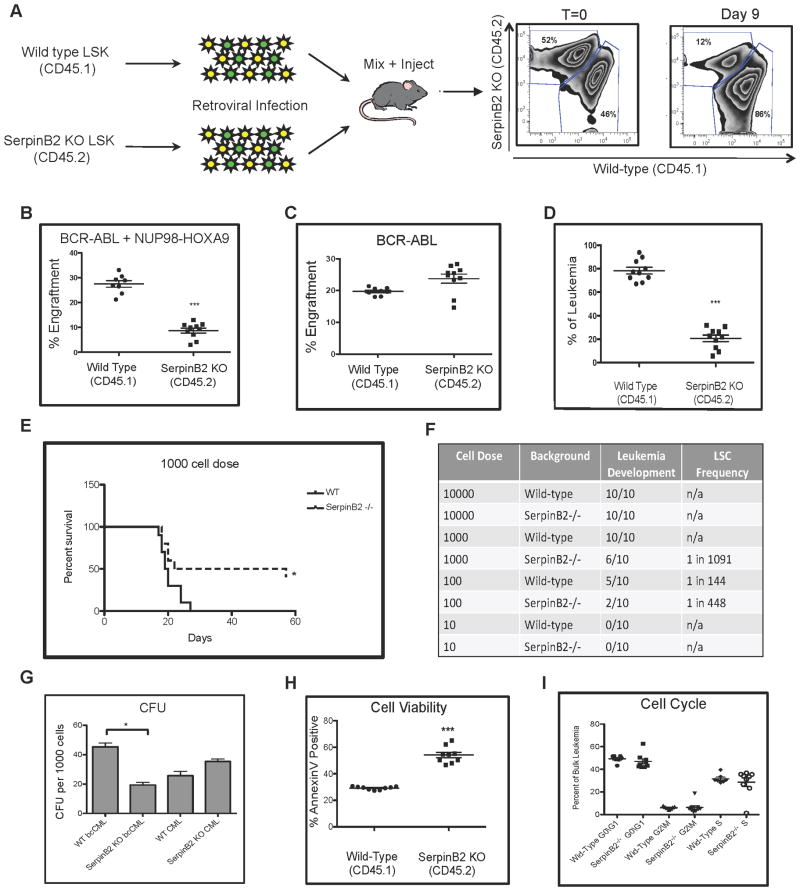
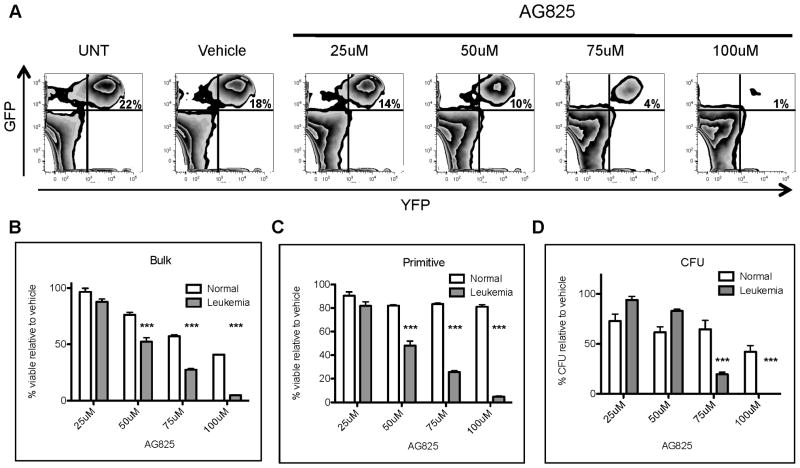
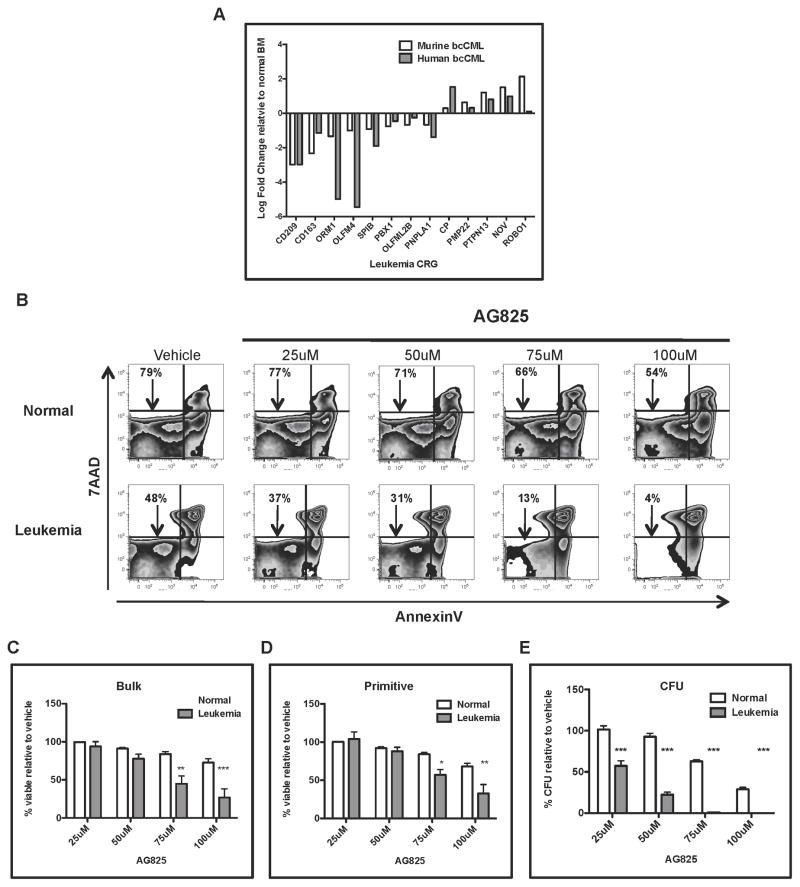
Leukemia stem cells (LSCs) represent a biologically distinct subpopulation of myeloid leukemias, with reduced cell cycle activity and increased resistance to therapeutic challenge. To better characterize key properties of LSCs, we employed a strategy based on identification of genes synergistically dysregulated by cooperating oncogenes. We hypothesized that such genes, termed "cooperation response genes" (CRGs), would represent regulators of LSC growth and survival. Using both a primary mouse model and human leukemia specimens, we show that CRGs comprise genes previously undescribed in leukemia pathogenesis in which multiple pathways modulate the biology of LSCs. In addition, our findings demonstrate that the CRG expression profile can be used as a drug discovery tool for identification of compounds that selectively target the LSC population. We conclude that CRG-based analyses provide a powerful means to characterize the basic biology of LSCs as well as to identify improved methods for therapeutic targeting.


Figures

Figure 1
Figure 1. Determining the leukemia CRG profile
(A) Retroviruses encoding BCR-ABL and NUP98-HOXA9 were used to infect primitive hematopoietic bone marrow cells (lineage−, Sca-1+, c-kit+, termed “LSK”). Infected LSK cells were transplanted into sub-lethally irradiated mice and primitive bone marrow cells from day 10 leukemic animals were purified based on lack of expression of a standard panel of lineage markers (Ter119, B220, Gr1, and CD3e) and expression of GFP and YFP, which indicates expression of BCR-ABL or NUP98-HOXA9 respectively. Four separate bone marrow populations were purified: GFP+/YFP− (BCR-ABL alone), GFP−/YFP+ (NUP98-HOXA9 alone), GFP+/YFP+ (BCR-ABL + NUP98-HOXA9), and GFP−/YFP− (normal). RNA was isolated from each cell population and genome-wide microarray analysis performed using the Affymetrix mouse 430 2.0 array platform. (B) Gene expression analysis scheme. CRGs were identified by first determining the differentially expressed genes (DEGs) in primitive acute leukemia samples (Double = GFP+/YFP+) relative to normal cells lacking BCR-ABL and NUP98-HOXA9 expression (WT). Next, expression of DEGs was compared to cells expressing BCR-ABL or NUP98-HOXA9 alone. Leukemia CRGs (CRGs) were defined as DEGs showing differential gene expression in comparison to both BCR-ABL and NUP98-HOXA expressing cells (see methods for details). (C) Hierarchical clustering analysis of the genes representing the CRG signature in normal (WT), BCR-ABL, NUP98-HOXA9, and BCR-ABL + NUP98-HOXA9 (Double) cells from all 6 replicates. (D) Analysis of gene classes represented by CRGs. See also Figure S1 and Table S1.
Figure 2
Figure 2. Expression of leukemia CRGs is conserved in mature and primitive populations
Leukemic animals were generated as described for Figure 1. Bone marrow was harvested from 4 independent groups of mice (n = 5 per group) and purified based on expression of BCR-ABL and NUP98-HOXA9 using GFP and YFP markers, respectively. Normal and leukemic cells were further purified based on expression of lineage markers and the stem cell antigen Sca-1. As shown in the left panel, three distinct populations were isolated: lineage positive cells (population A), lineage negative progenitors (population B), and LSC-enriched, Lin−/Sca+ (population C). RNA was isolated from each purified population and analyzed using a custom Taqman Low Density Array (TLDA) designed to interrogate the CRGs. The right panel shows a heatmap of relative expression of the CRGs in mature, progenitor, and LSC-enriched leukemia cells compared to their respective normal counterparts (Green = down-regulated, Red = up-regulated).
Figure 3
Figure 3. Identification of CRGs that regulate in vivo growth of leukemia cells
(A) Primary leukemia cells were purified from leukemic mice based on lack of lineage marker expression (Ter119, B220, Gr1, and CD3e). Primitive leukemia cells were then infected with a custom designed lentiviral RNAi library targeting all up-regulated CRGs. Twenty-four hours later, infected cells were harvested and divided into two fractions. The first sample (time zero) was immediately processed to isolate genomic DNA and the second sample was transplanted into recipient animals. Five replicates were performed for each RNAi pool. Eight days post-transplant bone marrow and spleen cells were harvested from recipient mice and genomic DNA was isolated for Illumina Deep Sequencing. (B) Heatmap showing the fold change across all replicates for each shRNA in the screen relative to time zero for bone marrow and spleen samples (Blue = decreased, Red = increased). (C) Level of depletion determined for Luciferase, LacZ, CP, Serinc2, GJB3, PMP22, EphA3, and SerpinB2 shRNA from the RNAi screen shown in panel B. Next, primary leukemia progenitors were purified and infected with control or CRG shRNA lentiviruses and transplanted into recipient animals. Each CRG was targeted by 2 independent shRNA encoding lentiviruses (1, 2). (D) Gene mRNA knockdown was confirmed by qRT-PCR. (E) Ten days post-transplant leukemic bone marrow was analyzed for expression of crimson marked shRNA expressing cells by flow cytometry and engraftment was compared to time zero (T=0). Percent engraftment of LacZ control or Serinc2, CP, PMP22, EphA3, GJB3 shRNA expressing cells relative to time zero. (NS= not significant, *** p<0.001). See also Figure S2 and S3.
Figure 4
Figure 4. SerpinB2 modulates LSC activity in vivo
(A) Primary blast crisis leukemia was generated using HSC-enriched bone marrow cells from either wild type or SerpinB2 knockout mice by co-expression of BCR-ABL and NUP98-HOXA9 as previously described. (B–C) Bone marrow from primary leukemic animals was analyzed for engraftment of cells expressing both BCR-ABL and NUP98-HOXA9, or BCR-ABL alone, using flow cytometry (*** p<0.001). (D) Primary leukemia bone marrow from wild type and SerpinB2 KO backgrounds were harvested, mixed at equal ratios, and transplanted into secondary recipient animals. Nine days post-transplant leukemic bone marrow was analyzed for engraftment of donor leukemia cells using flow cytometry and compared to time zero (T=0) (Top) (*** p<0.001). (E) Kaplan-Meier survival analysis of recipient mice transplanted with 1000 total leukemia cells from either wild type or SerpinB2 knockout primary leukemia (* p<0.01). (F) Limiting dilution results for LSC frequency between wild type and SerpinB2 knockout leukemias determined by L-CALC (Stem Cell Technologies), n=10. (G) Colony-forming ability of primary wild type or SeprinB2 KO bcCML (GFP+/YFP+) and CML(GFP+) cells (* p<0.01). (H) Percentage of apoptotic wild type or SeprinB2 KO leukemia cells analyzed by Annexin V staining (*** p<0.001). (I) Cell cycle analysis performed on primary wild type or SerpinB2 KO leukemia, n=10. See also Figure S4.
Figure 5
Figure 5. Tyrophostin AG825 is selectively cytotoxic to primitive murine leukemia cells
(A) Leukemic bone marrow cells were treated overnight with increasing concentrations of Tyrophostin AG825 (AG825). The following day, cells were harvested and analyzed by flow cytometry to determine relative toxicity to leukemic (GFP+/YFP+) vs. normal cells (GFP−/YFP−). (B–C) Normal or leukemia cells treated with AG825 overnight were harvested and labeled with annexin V and DAPI to analyze cell death using flow cytometry. Viability of bulk and primitive cells (Lin−) exposed to AG825 are shown. (D) Normal or leukemic cells were treated with AG825 overnight followed by methylcellulose culture to measure colony formation ability, CFU (*** p< 0.001). See also Figure S5 and S6.
Figure 6
Figure 6. Expression and function of leukemia CRGs is conserved in human blast crisis leukemia specimens
(A) Total RNA was isolated from CD34-enriched human or primitive murine leukemia cells and analyzed by qRT-PCR using custom Taqman Low Density Arrays (TLDA) designed to interrogate the CRGs. The relative expression in leukemia compared to normal counterparts was determined (n=8 human, n= 6 mouse). The 13 genes conserved between the two species and their relative expression is shown. (B) Normal or leukemic human specimens were treated overnight with increasing concentrations of Tyrophostin AG825 (AG825). Twenty-four hours later the cells were harvested and labeled with annexin V and DAPI for analysis of cell death using flow cytometry. (C–D) Viability of bulk and primitive (lin−) human cells treated with AG825 for twenty-four hours. (E) Normal or leukemic human cells were treated with AG825 overnight followed by methylcellulose culture to measure colony formation ability, CFU (* p<0.01), ** p< 0.01, *** p< 0.001). See also Figure S7 and Tables S2.

Comment in

References

    1. Antalis TM, La Linn M, Donnan K, Mateo L, Gardner J, Dickinson JL, Buttigieg K, Suhrbier A. The serine proteinase inhibitor (serpin) plasminogen activation inhibitor type 2 protects against viral cytopathic effects by constitutive interferon alpha/beta priming. The Journal of experimental medicine. 1998;187:1799–1811. - PMC - PubMed
    1. Benjamini YHY. Controlling the False Discovery Rate: a Practical and Powerful Approach to Multiple Testing. J R Statist Soc B. 1995;57:289–300.
    1. Bonnet D, Dick JE. Human acute myeloid leukemia is organized as a hierarchy that originates from a primitive hematopoietic cell. NatMed. 1997;3:730–737. - PubMed
    1. Brookes MJ, Hughes S, Turner FE, Reynolds G, Sharma N, Ismail T, Berx G, McKie AT, Hotchin N, Anderson GJ, et al. Modulation of iron transport proteins in human colorectal carcinogenesis. Gut. 2006;55:1449–1460. - PMC - PubMed
    1. Burnett A, Wetzler M, Lowenberg B. Therapeutic Advances in Acute Myeloid Leukemia. J Clin Oncol 2011 - PubMed

Publication types

MeSH terms

Associated data