. 2012 Nov;82(5):860-75.
doi: 10.1124/mol.112.080531. Epub 2012 Aug 3.

Investigating metabotropic glutamate receptor 5 allosteric modulator cooperativity, affinity, and agonism: enriching structure-function studies and structure-activity relationships

Affiliations

Investigating metabotropic glutamate receptor 5 allosteric modulator cooperativity, affinity, and agonism: enriching structure-function studies and structure-activity relationships

Karen J Gregory et al. Mol Pharmacol. 2012 Nov.

Abstract

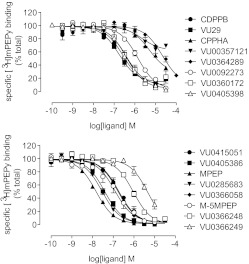
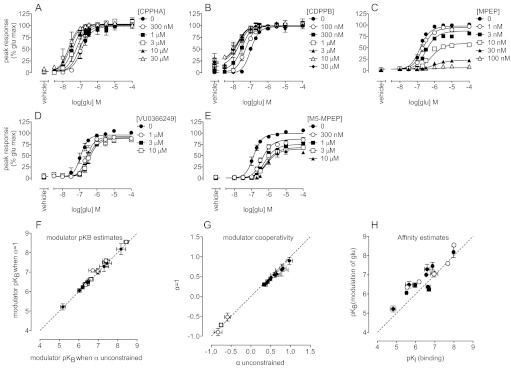
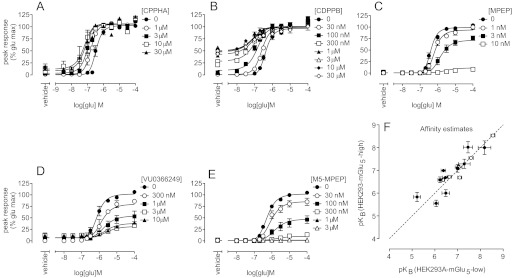
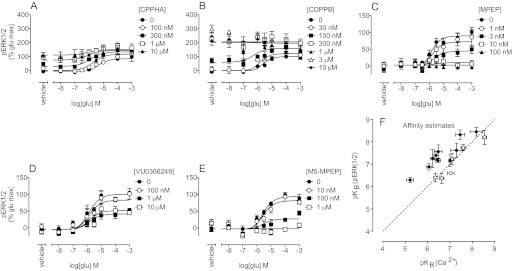
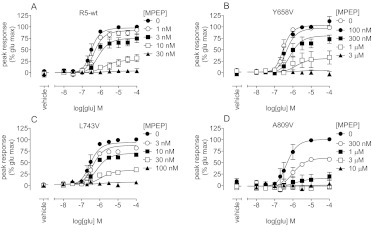
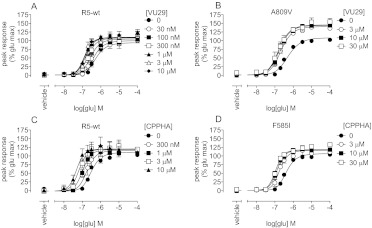
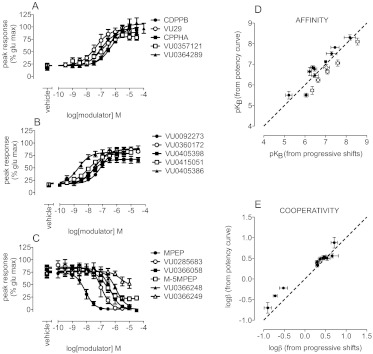
Drug discovery programs increasingly are focusing on allosteric modulators as a means to modify the activity of G protein-coupled receptor (GPCR) targets. Allosteric binding sites are topographically distinct from the endogenous ligand (orthosteric) binding site, which allows for co-occupation of a single receptor with the endogenous ligand and an allosteric modulator that can alter receptor pharmacological characteristics. Negative allosteric modulators (NAMs) inhibit and positive allosteric modulators (PAMs) enhance the affinity and/or efficacy of orthosteric agonists. Established approaches for estimation of affinity and efficacy values for orthosteric ligands are not appropriate for allosteric modulators, and this presents challenges for fully understanding the actions of novel modulators of GPCRs. Metabotropic glutamate receptor 5 (mGlu(5)) is a family C GPCR for which a large array of allosteric modulators have been identified. We took advantage of the many tools for probing allosteric sites on mGlu(5) to validate an operational model of allosterism that allows quantitative estimation of modulator affinity and cooperativity values. Affinity estimates derived from functional assays fit well with affinities measured in radioligand binding experiments for both PAMs and NAMs with diverse chemical scaffolds and varying degrees of cooperativity. We observed modulation bias for PAMs when we compared mGlu(5)-mediated Ca(2+) mobilization and extracellular signal-regulated kinase 1/2 phosphorylation data. Furthermore, we used this model to quantify the effects of mutations that reduce binding or potentiation by PAMs. This model can be applied to PAM and NAM potency curves in combination with maximal fold-shift data to derive reliable estimates of modulator affinities.


Figures

Fig. 1.
Fig. 1.
Influences of agonist concentration, modulator affinity, and cooperativity on allosteric modulator potency. A and B, simulations of the effects of different agonist concentrations on the potencies of a negative allosteric modulator (A) and a positive allosteric modulator (B). EC100**, agonist concentration 30-fold in excess of that required to elicit a maximal response. C and D, literature findings on mGlu5 NAM potency and affinity estimates (C) and mGlu5 PAM potency and affinity estimates (D) (Huang et al., 2004; Poon et al., 2004; Roppe et al., 2004; Chua et al., 2005; Tehrani et al., 2005; de Paulis et al., 2006; Kulkarni et al., 2006, 2009; Jaeschke et al., 2007; Milbank et al., 2007; Liu et al., 2008; Vanejevs et al., 2008; Felts et al., 2009, 2010; Galambos et al., 2010; Rodriguez et al., 2010; Wágner et al., 2010; Zhang et al., 2010; Alagille et al., 2011; Gilbert et al., 2011; Lindemann et al., 2011; Sams et al., 2011; Weiss et al., 2011; Zou et al., 2011; Mueller et al., 2012). Dashed lines, unity; dotted lines, potency and affinity within 3-fold of each other; solid lines, 10-fold difference.
Fig. 2.
Fig. 2.
Structures of mGlu5 allosteric modulators included in this study. VU0366248 and VU0366249 were originally reported as compounds 41 and 42, respectively (Felts et al., 2010).
Fig. 3.
Fig. 3.
Inhibition of [3H]methoxy-PEPy binding to wild-type mGlu5-expressing HEK293A cell membranes. Data represent the mean ± S.E.M. from at least three independent determinations.
Fig. 4.
Fig. 4.
Allosteric modulation of glutamate concentration-response curves for Ca2+ mobilization in the low-level mGlu5-expressing HEK293A cell line. A and B, in the low-level, wild-type mGlu5-expressing HEK293A cell line, CPPHA (A) and CDPPB (B) induced leftward shifts in the glutamate concentration-response curve for intracellular Ca2+ mobilization, with no change in the maximal response. C to E, MPEP (C), VU0366249 (D), and M-5MPEP (E) inhibited glutamate-stimulated intracellular Ca2+ mobilization. F, modulator affinity estimates that were calculated by determining the composite cooperativity parameter αβ for PAMs (●) and allowing α to float for NAMs (○) (x-axis) or assuming α = 1 and calculating logβ (y-axis) were compared. G, for calculated cooperativity estimates, the assumption of α = 1 had no effect on the apparent cooperativity between glutamate and PAMs (●) and weak NAMs (○). H, affinity estimates for PAMs (●) and NAMs (○) determined from radioligand binding assays (x-axis) and Ca2+ mobilization assays (y-axis) in low-level mGlu5-expressing HEK293A cells were compared. Dashed line, unity. Data represent the mean ± S.E.M. from at least three independent determinations. Error bars not shown lie within the dimensions of the symbols.
Fig. 5.
Fig. 5.
Allosteric modulation of glutamate concentration-response curves for Ca2+ mobilization in the high-level mGlu5-expressing HEK293A cell line. A and B, in the high-level mGlu5-expressing HEK293A cell line, increased agonist activity was seen for CPPHA (A) and CDPPB (B), as well as induction of a leftward shift in the glutamate concentration-response curve for Ca2+ mobilization. C to E, MPEP (C), VU0366249 (D), and M-5MPEP (E) inhibited glutamate stimulation of Ca2+ mobilization. F, affinity estimates for NAMs (○) and PAMs (●) determined from Ca2+ mobilization assays in low-level (x-axis) versus high-level (y-axis) mGlu5-expressing cell lines were compared. Dashed line, unity. Data represent the mean ± S.E.M. from at least three independent determinations. Error bars not shown lie within the dimensions of the symbols.
Fig. 6.
Fig. 6.
Allosteric modulation of glutamate concentration-response curves for ERK1/2 phosphorylation in the low-level mGlu5-expressing HEK293A cell line. A and B, in the low-level mGlu5-expressing cell line, CPPHA (A) and CDPPB (B) displayed agonist activity and potentiated the glutamate concentration-response curve for phosphorylation of ERK1/2. C to E, MPEP (C), VU0366249 (D), and M-5MPEP (E) inhibited the glutamate-stimulated phosphorylation of ERK1/2. F, affinity estimates for PAMs (●) and NAMs (○) determined from ERK1/2 phosphorylation assays (y-axis) and Ca2+ mobilization assays (x-axis) in the low-level mGlu5-expressing cell line were compared. Dashed line, unity. Data represent the mean ± S.E.M. from at least three independent determinations. Error bars not shown lie within the dimensions of the symbols.
Fig. 7.
Fig. 7.
Effects of single point mutations of mGlu5 on MPEP inhibition of mGlu5-mediated Ca2+ mobilization in response to glutamate. Translocation of glutamate concentration-response curves in the presence of the indicated concentrations of MPEP in polyclonal HEK293A cells expressing wild-type (A), Y658V (B), L743V (C), or A809V (D) mGlu5 was determined. Data represent the mean ± S.E.M. from at least three independent determinations. Error bars not shown lie within the dimensions of the symbols.
Fig. 8.
Fig. 8.
Effects of single point mutations of mGlu5 on potentiation by VU29 and CPPHA of mGlu5-mediated Ca2+ mobilization in response to glutamate. A and B, translocation of glutamate concentration-response curves in the presence of the indicated concentrations of VU29 in polyclonal HEK293A cells expressing wild-type (A) or A809V (B) mGlu5 was determined. C and D, potentiation of glutamate concentration-response curves for Ca2+ mobilization by the indicated concentrations of CPPHA in polyclonal HEK293A cells expressing wild-type (C) or F585I (D) mGlu5 was determined. Data represent the mean ± S.E.M. from at least three independent determinations. Error bars not shown lie within the dimensions of the symbols.
Fig. 9.
Fig. 9.
Estimation of allosteric modulator cooperativity and affinity values from potency curves. A and B, allosteric modulator potency curves were determined for the indicated positive allosteric modulators in the presence of an EC20 concentration of glutamate. CPPHA and VU0364289 both achieved maximal responses to glutamate; therefore, logβ values were constrained to equal the average maximal leftward shift in the glutamate concentration-response curves (Table 6) for estimations of pKB. For all other PAMs, both logβ and pKB values were determined through nonlinear regression analyses. C, negative allosteric modulators were assessed for their ability to inhibit a submaximal glutamate response. D, affinity estimates from potency curves (y-axis) and from progressive fold-shift analyses (x-axis) for PAMs (●) and NAM (○) showed strong correlation. E, strong correlation was observed between logβ values estimated through nonlinear regression from modulator potency curves (y-axis) and from progressive fold-shift analyses (x-axis). Data represent the mean ± S.E.M. from at least three independent determinations. Error bars not shown lie within the dimensions of the symbols. Dashed line, unity.

Similar articles

Cited by

References

    1. Alagille D, DaCosta H, Chen Y, Hemstapat K, Rodriguez A, Baldwin RM, Conn PJ, Conn JP, Tamagnan GD. (2011) Potent mGlu5 antagonists: pyridyl and thiazolyl-ethynyl-3,5-disubstituted-phenyl series. Bioorg Med Chem Lett 21:3243–3247 - PMC - PubMed
    1. Bradley SJ, Watson JM, Challiss RA. (2009) Effects of positive allosteric modulators on single-cell oscillatory Ca2+ signaling initiated by the type 5 metabotropic glutamate receptor. Mol Pharmacol 76:1302–1313 - PMC - PubMed
    1. Bradley SJ, Langmead CJ, Watson JM, Challiss RA. (2011) Quantitative analysis reveals multiple mechanisms of allosteric modulation of the mGlu5 receptor in rat astroglia. Mol Pharmacol 79:874–885 - PMC - PubMed
    1. Chen Y, Goudet C, Pin JP, Conn PJ. (2008) N-{4-Chloro-2-[(1,3-dioxo-1,3-dihydro-2H-isoindol-2-yl)methyl]phenyl}-2-hydroxybenzamide (CPPHA) acts through a novel site as a positive allosteric modulator of group 1 metabotropic glutamate receptors. Mol Pharmacol 73:909–918 - PubMed
    1. Chen Y, Nong Y, Goudet C, Hemstapat K, de Paulis T, Pin JP, Conn PJ. (2007) Interaction of novel positive allosteric modulators of metabotropic glutamate receptor 5 with the negative allosteric antagonist site is required for potentiation of receptor responses. Mol Pharmacol 71:1389–1398 - PubMed

Publication types

Substances

LinkOut - more resources