. 2012 Aug 24;37(2):290-301.
doi: 10.1016/j.immuni.2012.05.021. Epub 2012 Aug 2.

Adrenergic nerves govern circadian leukocyte recruitment to tissues

Affiliations

Adrenergic nerves govern circadian leukocyte recruitment to tissues

Christoph Scheiermann et al. Immunity. .

Abstract

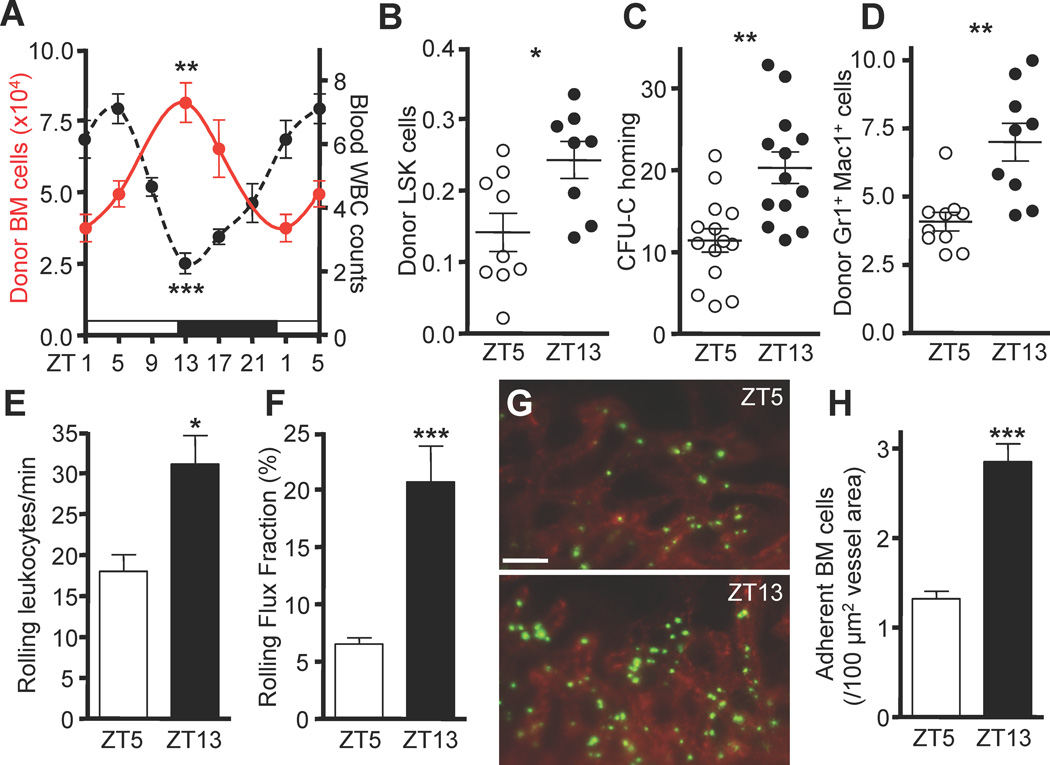
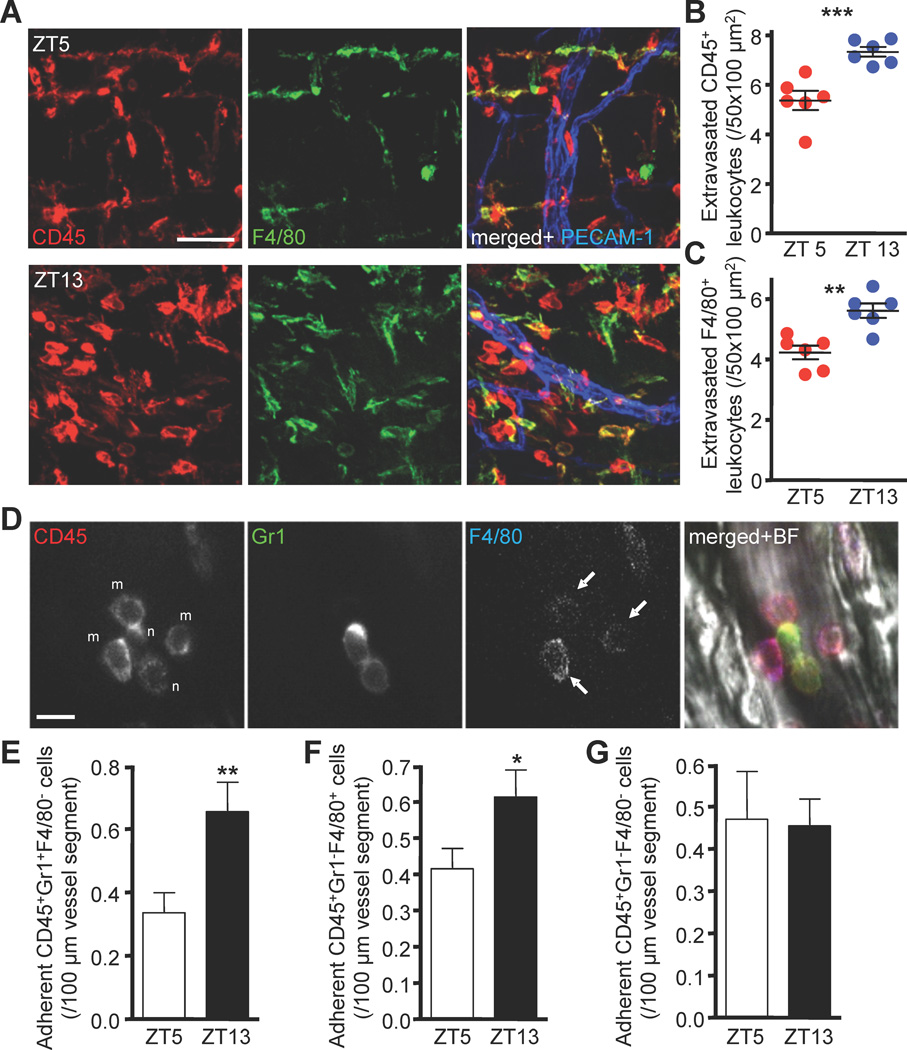
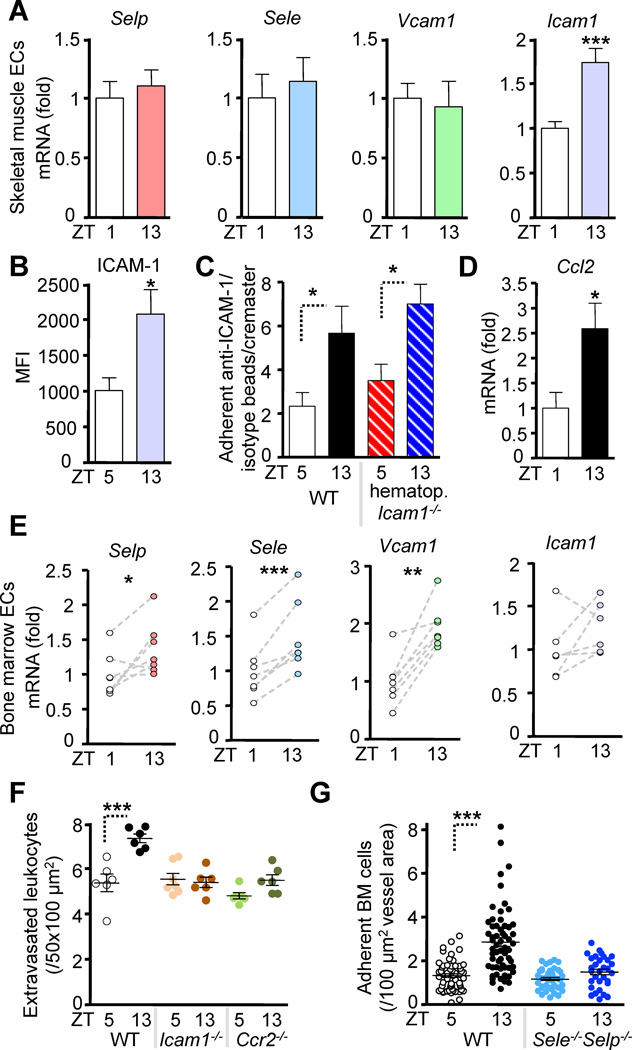
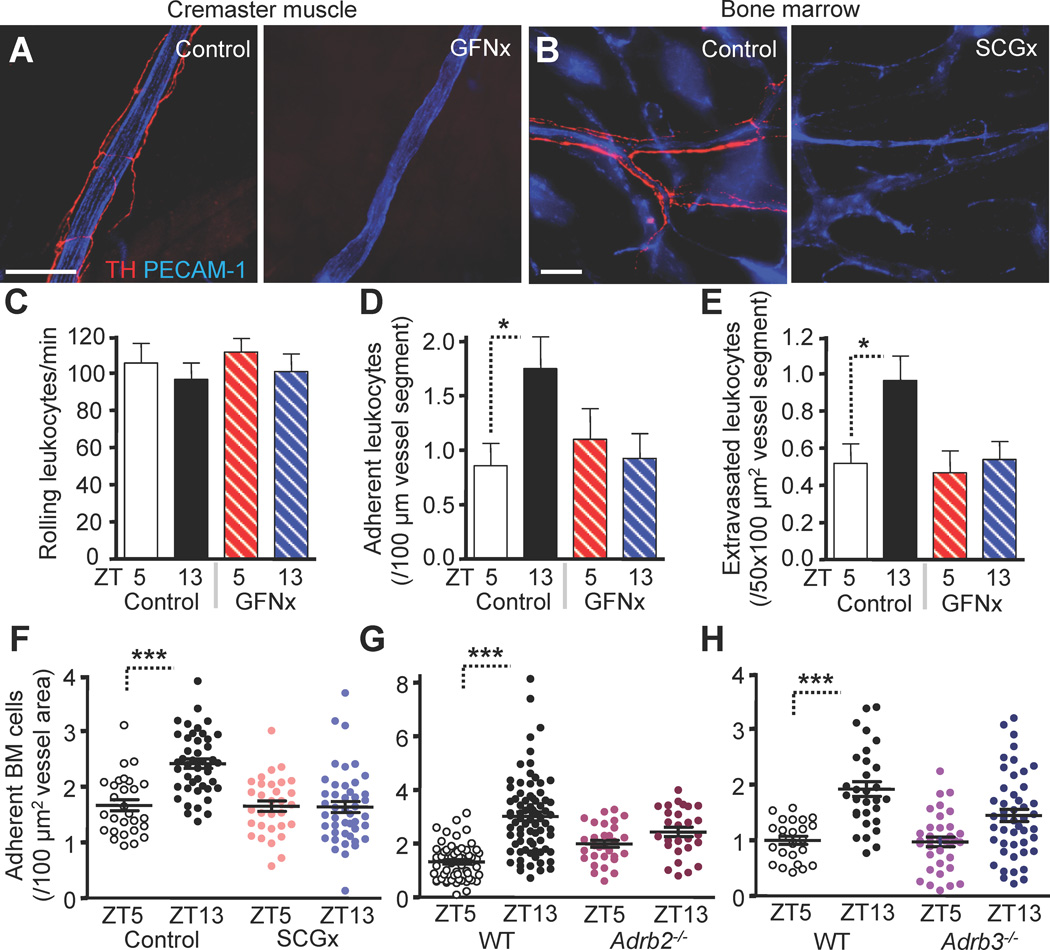
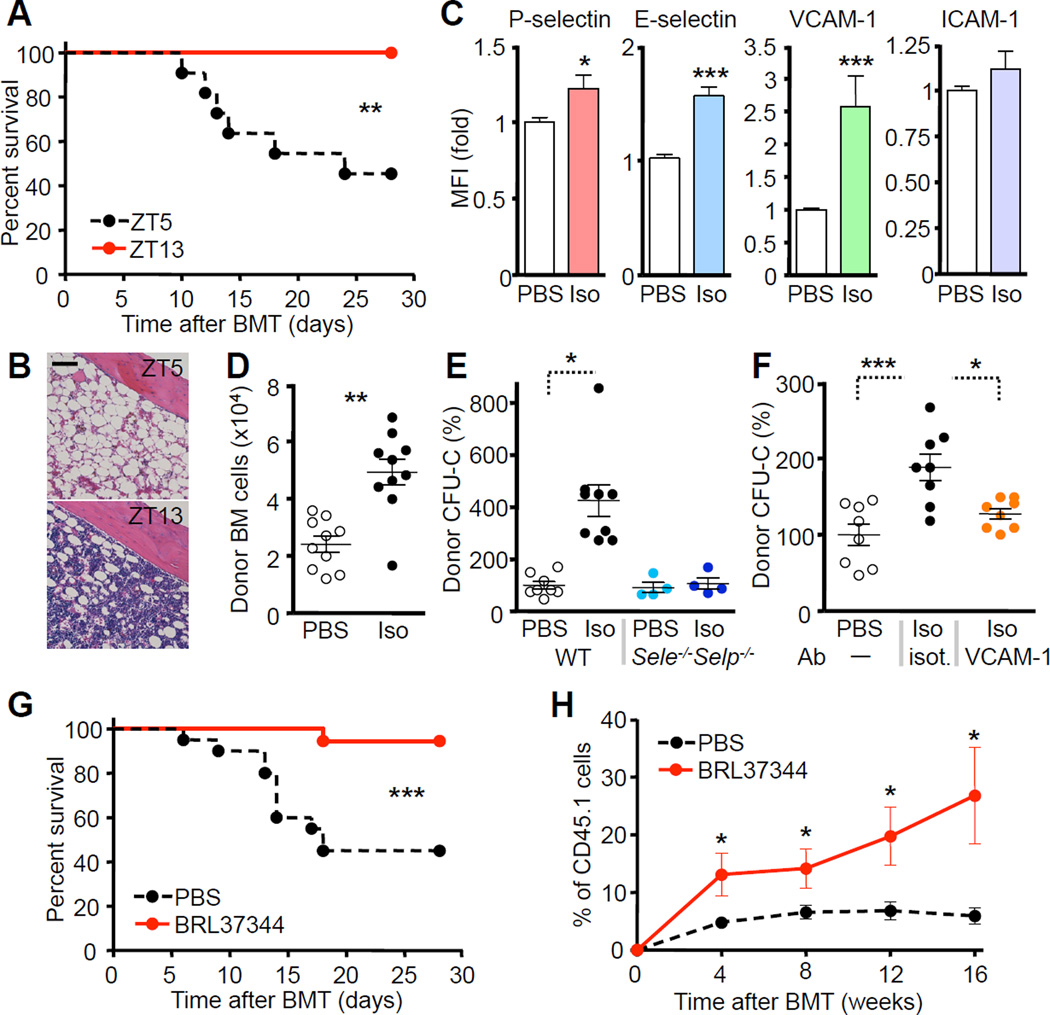
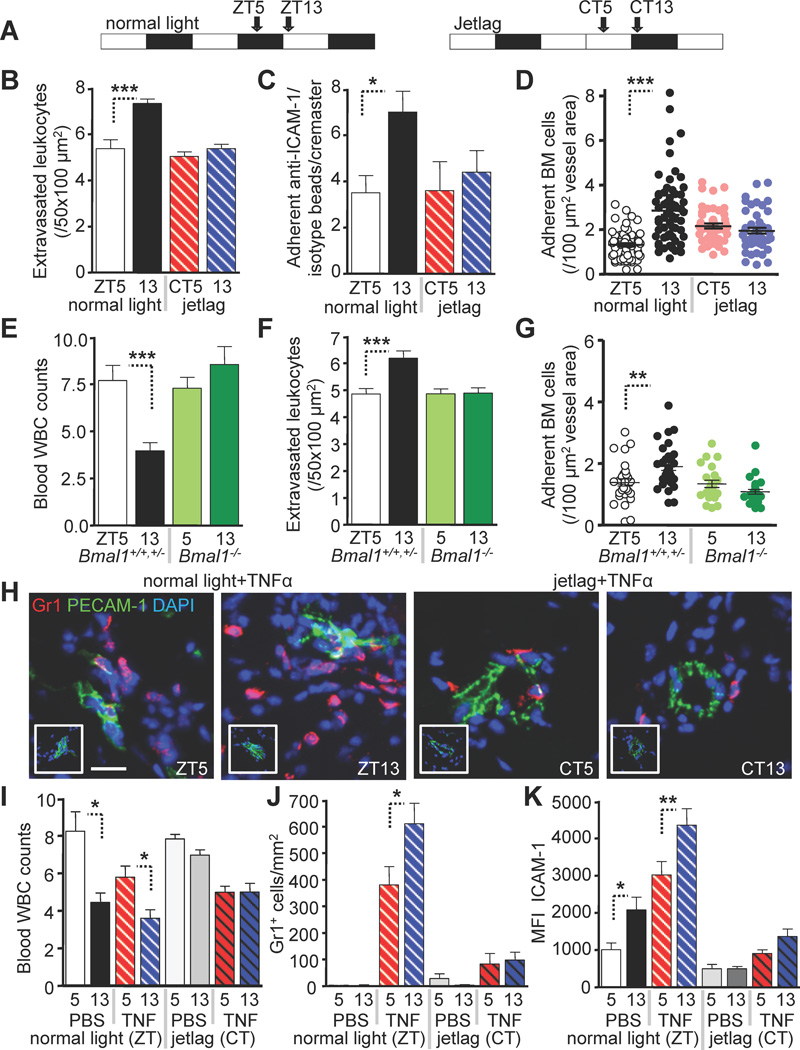
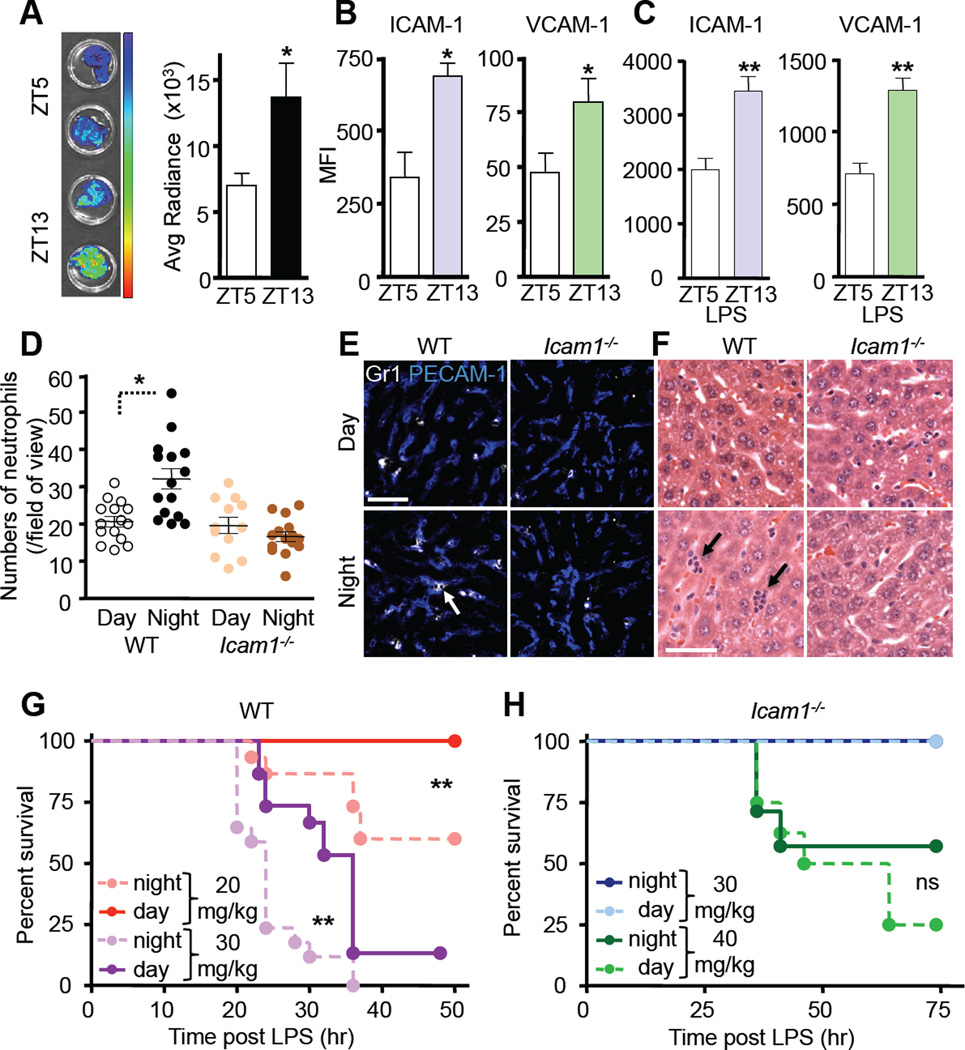
The multistep sequence leading to leukocyte migration is thought to be locally regulated at the inflammatory site. Here, we show that broad systemic programs involving long-range signals from the sympathetic nervous system (SNS) delivered by adrenergic nerves regulate rhythmic recruitment of leukocytes in tissues. Constitutive leukocyte adhesion and migration in murine bone marrow (BM) and skeletal-muscle microvasculature fluctuated with circadian peak values at night. Migratory oscillations, altered by experimental jet lag, were implemented by perivascular SNS fibers acting on β-adrenoreceptors expressed on nonhematopoietic cells and leading to tissue-specific, differential circadian oscillations in the expression of endothelial cell adhesion molecules and chemokines. We showed that these rhythms have physiological consequences through alteration of hematopoietic cell recruitment and overall survival in models of septic shock, sickle cell vaso-occlusion, and BM transplantation. These data provide unique insights in the leukocyte adhesion cascade and the potential for time-based therapeutics for transplantation and inflammatory diseases.


Figures

Figure 1
Figure 1. Circadian oscillations of hematopoietic cell recruitment to the bone marrow
(A) Time course of homed adoptively transferred BM cells (red) and corresponding WBC numbers in blood (×103/µl, black). Light and dark cycles are indicated by white and black bars, respectively. n = 4–15. (B) Quantification of homing of donor LSK cells (×103) 3h after 5×10⁶ BM cells were transferred to recipients. n = 8–9. (CD) Circadian oscillations in homing of colony-forming units in culture (CFU-C) (in %) (C) and neutrophils (×104) (D). n = 9–14. (EF) Quantifications of absolute numbers of rolling leukocytes in BM sinusoids (E) and the rolling flux fraction (F). n = 33–43 vessels from 8–9 mice per group. (G–H) In vivo images (G) and quantification (H) of fluorescently labeled adherent BM cells (green) after adoptive transfer. BM sinusoids were identified with rhodamine 6G (red). n = 60 areas from 7 mice per group. *P<0.05, **P<0.01, ***P<0.001. Scale bar: 50 µm. See also Figure S1 and Table S1.
Figure 2
Figure 2. Circadian oscillations of leukocyte recruitment to skeletal muscle
(AC) Ex vivo images (A) and quantifications (BC) of extravasated CD45+ and F4/80+ leukocytes situated around postcapillary venules as analyzed by whole-mount immunofluorescence staining of cremaster muscle tissues. n = 6. (DG) Adherent leukocyte subsets as determined by multichannel fluorescent intravital microscopy. (D) In vivo images showing antibody-stained adherent leukocytes. Adherent neutrophils, n (E), monocytes, arrows, m (F) and lymphocytes (G). n = 142–148 vessels quantified from 7 mice per group. *P<0.05, **P<0.01, ***P<0.001. Scale bars, A: 50 µm, D: 10 µm. See also Figure S2 and Table S1.
Figure 3
Figure 3. Oscillations of promigratory factors mediate circadian leukocyte recruitment
(A) Q-PCR analysis of sorted cremasteric endothelial cells (ECs) for P-selectin (Selp), E-selectin (Sele), Vcam1 and Icam1. n = 12–16. (B) Quantification of ICAM-1 protein expression in muscle by confocal immunofluorescence imaging of frozen sections. n = 9. (C) MFIM quantification of specific (anti-ICAM-1-coated) vs. non-specific (IgG-coated) fluorescent microsphere adhesion in the cremasteric microvasculature in WT and hematopoietic Icam1−/−/WT BM chimeras. n = 5–6. (D) Q-PCR analysis of sorted cremasteric endothelial cells for Ccl2. n = 6. (E) Q-PCR of sorted BM endothelial cells. n = 6–7. (F) Numbers of extravasated CD45+ leukocytes as analyzed by whole-mount immunofluorescence staining of cremaster muscle tissues in WT control, Icam1−/− and Ccr2−/− animals. n = 6–7. (G) Quantification of adherent fluorescently labeled cells to BM sinusoids in WT and Selp−/−Sele−/− mice after adoptive transfer. n = 31–75 areas from 4–8 mice per group. *P<0.05, **P<0.01, ***P<0.001. See also Figure S3.
Figure 4
Figure 4. Requirements of local adrenergic nerves
(AF) Unilateral surgical denervation of the genitofemoral nerve (GFNx) or the superior cervical ganglion (SCGx). (AB) Images of TH+ fibers (red) and associated vessels (PECAM-1, blue) in cremaster muscle (A) or calvarium (B) 4 weeks after GFNx or SCGx of the contralateral control and operated sides. (CE) BIM microscopy of exteriorized cremaster muscle tissues quantifying rolling (C), adhesion (D) and transmigration (E) after GFNx. n = 28–40 vessels from 3–4 mice per group. (FH) Quantification of adherent fluorescently labeled cells to BM sinusoids after SCGx (F) or in Adrb2−/− (G) or Adrb3−/− (H) mice after adoptive transfer. n = 28–45 vessels from 5–6 mice per group. *P<0.05, ***P<0.001. Scale bars: 100 µm. See also Figure S4 and Table S2.
Figure 5
Figure 5. β-adrenergic stimulation enhances hematopoietic progenitor reconstitution after transplantation
(A) Survival curves after circadian BM transplantation with limiting numbers of BM cells (2.5×10⁴) into lethally irradiated recipients. n = 10. (B) Representative H&E micrographs 30 days after circadian BMT. (C) Flow cytometric analysis of endothelial cell adhesion molecule expression after PBS or isoproterenol (iso) treatment in recipients. n = 5. (D) Quantification of donor BM cells that homed to the BM of recipients treated with PBS or isoproterenol. n = 10. (EF) Quantification of donor CFU-Cs that homed to the BM of recipients treated with PBS or isoproterenol in WT or Selp−/−Sele−/− mice (E) or after treatment with an isotype (isot.) or anti-VCAM-1 blocking antibody (F). n = 4–9. (G) Survival curves after transplantation with limiting numbers of BM cells (2.5×10⁴) into lethally irradiated recipients pre-treated with PBS or BRL37344. n = 18–20. (H) Effect of BRL37344 on homing of long-term repopulating HSCs. n = 6. *P<0.05, **P<0.01, ***P<0.001. Scale bar: 100 µm. See also Figure S5.
Figure 6
Figure 6. Circadian rhythms in leukocyte recruitment are entrained by photic cues
(A) Light regime under normal and jetlag conditions as entrained using a light cycler. (B) Quantification of extravasated CD45+ leukocytes in the cremaster muscle as analyzed by whole-mount immunofluorescence staining in mice under normal light and jetlag conditions. n = 3–6. (C) Quantification of specific vs. non-specific sphere adhesion in hematopoietic Icam1−/−/WT BM chimeras under normal light and jetlag conditions. n = 5–6. (D) Quantification of adherent fluorescently labeled cells to BM sinusoids in mice under normal light and jetlag conditions. n = 46–61 areas quantified from 4–5 mice per group. (EG) Circadian oscillations in Bmal1−/− mice and control littermates after 3 weeks of constant darkness. (E) Blood leukocyte counts (×103/µl). n = 4–8. (F) Numbers of extravasated CD45+ leukocytes as analyzed by whole-mount immunofluorescence staining of cremaster muscle tissues. n = 24–30 vessels from 4 mice per group. (G) Numbers of adherent fluorescently labeled cells to BM sinusoids after adoptive transfer. n = 22–31 areas quantified from 3 mice per group. (HJ) Representative images (PBS in insets) (H), blood leukocyte counts (×103/µl) (I) and quantification of TNFα-induced neutrophil infiltration in sections of the cremaster muscle (J) under normal light and jetlag conditions. n = 3–9. (K) Quantification of ICAM-1 protein expression in frozen sections harvested from the same mice. *P<0.05, **P<0.01, ***P<0.001. Scale bar: 50 µm. See also Figure S6.
Figure 7
Figure 7. Circadian time influences leukocyte recruitment in septic shock
(A) Bioluminescence imaging and quantifications of harvested liver after adoptive transfer of Vav-Cre:luciferase-expressing BM cells to recipients at ZT5 or ZT13. n = 7. (BC) Quantification of endothelial cell adhesion molecule expression levels in liver at steady state (B) and after 12h stimulation with LPS (C) by immunofluorescence confocal imaging of frozen tissue sections. n = 4–7. (D) Quantification of LPS-induced neutrophil infiltration in frozen liver sections of WT or Icam1−/− animals. n = 6. (EF) Representative images of neutrophil infiltration in liver sections as assessed by immunofluorescence confocal imaging (E) and H&E staining (F) showing neutrophils clusters (arrows). (GH) Survival curves of WT (G) and Icam1−/− (H) animals after LPS-induced septic shock. n = 7–17. *P<0.05, **P<0.01. Scale bars: 50 µm. See also Figure S7.

Comment in

References

    1. Alito AE, Romeo HE, Baler R, Chuluyan HE, Braun M, Cardinali DP. Autonomic nervous system regulation of murine immune responses as assessed by local surgical sympathetic and parasympathetic denervation. Acta Physiol Pharmacol Latinoam. 1987;37:305–319. - PubMed
    1. Anea CB, Zhang M, Stepp DW, Simkins GB, Reed G, Fulton DJ, Rudic RD. Vascular disease in mice with a dysfunctional circadian clock. Circulation. 2009;119:1510–1517. - PMC - PubMed
    1. Brown DL, Feskanich D, Sanchez BN, Rexrode KM, Schernhammer ES, Lisabeth LD. Rotating night shift work and the risk of ischemic stroke. Am J Epidemiol. 2009;169:1370–1377. - PMC - PubMed
    1. Bullard DC, Kunkel EJ, Kubo H, Hicks MJ, Lorenzo I, Doyle NA, Doerschuk CM, Ley K, Beaudet AL. Infectious susceptibility and severe deficiency of leukocyte rolling and recruitment in E-selectin and P-selectin double mutant mice. The Journal of experimental medicine. 1996;183:2329–2336. - PMC - PubMed
    1. Butcher EC. Leukocyte-endothelial cell recognition: three (or more) steps to specificity and diversity. Cell. 1991;67:1033–1036. - PubMed

Publication types

MeSH terms