. 2012 Nov;27(11):4079-87.
doi: 10.1093/ndt/gfs313. Epub 2012 Aug 3.

Urine podocin:nephrin mRNA ratio (PNR) as a podocyte stress biomarker

Affiliations

Urine podocin:nephrin mRNA ratio (PNR) as a podocyte stress biomarker

Akihiro Fukuda et al. Nephrol Dial Transplant. 2012 Nov.

Abstract

Background: Proteinuria and/or albuminuria are widely used for noninvasive assessment of kidney diseases. However, proteinuria is a nonspecific marker of diverse forms of kidney injury, physiologic processes and filtration of small proteins of monoclonal and other pathologic processes. The opportunity to develop new glomerular disease biomarkers follows the realization that the degree of podocyte depletion determines the degree of glomerulosclerosis, and if persistent, determines the progression to end-stage kidney disease (ESKD). Podocyte cell lineage-specific mRNAs can be recovered in urine pellets of model systems and in humans. In model systems, progressive glomerular disease is associated with decreased nephrin mRNA steady-state levels compared with podocin mRNA. Thus, the urine podocin:nephrin mRNA ratio (PNR) could serve as a useful progression biomarker. The use of podocyte-specific transcript ratios also circumvents many problems inherent to urine assays.

Methods: To test this hypothesis, the human diphtheria toxin receptor (hDTR) rat model of progression was used to evaluate potentially useful urine mRNA biomarkers. We compared histologic progression parameters (glomerulosclerosis score, interstitial fibrosis score and percent of podocyte depletion) with clinical biomarkers [serum creatinine, systolic blood pressure (BP), 24-h urine volume, 24-h urine protein excretion and the urine protein:creatinine ratio(PCR)] and with the novel urine mRNA biomarkers.

Results: The PNR correlated with histologic outcome as well or better than routine clinical biomarkers and other urine mRNA biomarkers in the model system with high specificity and sensitivity, and a low coefficient of assay variation.

Conclusions: We concluded that the PNR, used in combination with proteinuria, will be worth testing for its clinical diagnostic and decision-making utility.


Figures
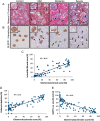
Fig. 1.
Fig. 1.
Time course of events in the rat hDTR model of progression. (A) Representative histology for Masson's trichrome-stained sections illustrating progressive glomerulosclerosis and interstitial fibrosis from mild to severe. Arrows show sclerosed and partially sclerosed glomeruli. The boxes (top left) show higher magnification of an individual glomerulus. (B) Representative GLEPP1 peroxidase-stained sections illustrating progressive loss of podocytes so that in mild injury there are patchy areas of podocyte loss associated with focal segmental glomerulosclerosis; in moderate injury, there are larger focal segmental areas of podocyte loss associated with a greater degree of focal and segmental and occasional global sclerosis with mild interstitial fibrosis; and in severe disease there is global loss of podocytes associated with global glomerulosclerosis and marked interstitial fibrosis. Arrows show sclerosed and partially sclerosed glomeruli. The boxes (top left) show higher magnification of an individual glomerulus. (C–E) Correlation diagrams showing the wide range of glomerulosclerosis evaluated for this analysis and the close correlation between glomerulosclerosis and interstitial fibrosis (C), glomerulosclerosis and podocyte number per glomerular tuft (D) and glomerulosclerosis and percentage of tuft area that is GLEPP1 peroxidase positive as an inverse marker of podocyte depletion (E).
Fig. 2.
Fig. 2.
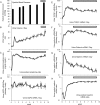
Time course of progression to ESKD in the hDTR model for a group that progressed to ESKD within 12 weeks corresponding to the severe group shown in Figure 1 (n = 25). (A). Systolic BP progressively increases. (B). Urine volume per 24-h progressive increases as CKD develops. (C). Proteinuria as measured by the urine PCR increases early during the injury process and remains elevated throughout the progression process. (D) Twenty-four hour urine AQP2 mRNA as a tubular marker becomes only mildly elevated during the progression process reflecting nephron loss. (E). Twenty-four hour urine TGFβ1 mRNA becomes elevated by 2 weeks after initiation of injury and remains elevated throughout the progression process. (F). Twenty-four hour urine podocin mRNA becomes elevated early during injury (in parallel with urine PCR) and remains elevated throughout the progression process. (G) Twenty-four hour urine nephrin mRNA increases in association with acute toxin-induced podocyte injury but then returns towards baseline during the progression process. (H) The urine PNR decreases in association with the acute toxin-induced podocyte injury (when there is high nephrin mRNA excretion) and then increases by 2 weeks and remains stably elevated throughout the chronic progression process. All data were expressed as mean ± SEM. The open bar above each diagram illustrates the time for which data were averaged for the correlation analysis shown in Table 1. Therefore, correlation analysis for BP, urine volume and serum creatinine used only week 8–9 data. Correlations for urine PCR and urine mRNA biomarkers used the average of 3–9 week data during the chronic progression phase of injury.
Fig. 3.
Fig. 3.
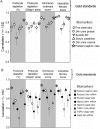
Comparison of absolute correlations (r values) between the ‘gold standard’ progression parameters and clinical parameters of progression (panel A) and urine mRNA biomarkers (panel B). Gold standard progression variables are shown as percent podocyte depletion, GLEPP1-positive podocyte area as a percentage of tuft area, glomerular sclerosis score as assessed by Masson's trichrome staining and interstitial fibrosis area as a percentage of the interstitial area stained blue by Masson's trichrome. In panel A, the correlations of ‘gold standards’ with clinical parameters are (urine PCR (prot:creat ratio), the 24-h urine protein excretion (24-h urine protein), the systolic BP, the serum creatinine and the urine PNR (podocin:nephrin ratio). In panel B, the urine mRNA biomarkers are evaluated in relation to ‘gold standard’ parameters of progression including the urine PNR (podocin:nephrin ratio), the timed urine podocin mRNA excretion (podocin 24-h mRNA), the podocin: AQP2 mRNA ratio (podocin:AQP2 ratio), the timed nephrin mRNA excretion (nephrin 24-h mRNA), the nephrin: AQP2 mRNA ratio (nephrin:AQP2 ratio), the timed TGFβ1 mRNA excretion (TGFβ1 24-h mRNA), the TGFβ1:AQP2 mRNA ratio (TGFβ1:AQP2 ratio) and the timed AQP2 excretion (AQP2 24-h mRNA). Note that the PNR correlates with ‘gold standard’ progression parameters as well as any clinical biomarkers and better than other mRNA biomarkers and also 24-h proteinuria. Vertical error bars show 95% confidence intervals for the true correlation coefficient.
Fig. 4.
Fig. 4.
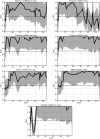
ROC analysis of urine mRNA biomarkers to predict progression to ESKD in the hDTR rat model. ROC analysis was used to determine the potential for a biomarker measured at a point in time to predict which hDTR rats receiving a variable degree of initial injury induced by IP injection of DT progressed to ESKD over a 6-month period (n = 9) and which would not (n = 8). Daily urine samples were collected and assayed for nephrin, podocin, TGFβ1 and AQP2 mRNAs. Injury occurs in two phases. An initial acute injury phase caused by the DT injection occurs before 21 days. In rats that receive a critical degree of injury, this first phase is followed by a progression phase until rats reach ESKD. An AUC of 0.5 is a random result. An AUC of 1 is a perfect prediction. The shaded regions show 95% confidence intervals for the true AUC.
Fig. 5.
Fig. 5.
Coefficients of variation for the mRNA assays. The cv for urine mRNA measurements was calculated from 100 randomly selected samples from 46 rats which were each assayed in different assays on different days and compared with the mean value for the chronic phase of progression for each rat. The values provided therefore show the variation around the mean for a given rat over time and reflect both inter-assay and intra-assay variations as well as the day-to-day biological variations.

References

    1. Kriz W. Podocyte is the major culprit accounting for the progression of chronic renal disease. Microsc Res Tech. 2002;57:189–195. - PubMed
    1. Wiggins R. The spectrum of podocytopathies: a unifying view of glomerular diseases. Kidney Int. 2007;71:1205–1214. - PubMed
    1. Pagtalunan ME, Miller PL, Jumping-Eagle S, et al. Podocyte loss and progressive glomerular injury in type II diabetes. J Clin Invest. 1997;99:342–348. - PMC - PubMed
    1. Meyer TW, Bennett PH, Nelson RG. Podocyte number predicts long-term urinary albumin excretion in Pima Indians with type II diabetes and microalbuminuria. Diabetologia. 1999;42:1341–1344. - PubMed
    1. Steffes MW, Schmidt D, McCrery R, et al. International diabetic nephropathy study group: glomerular cell number in normal subjects and type I diabetes patients. Kidney Int. 2001;59:2104–2113. - PubMed

Publication types

MeSH terms