

doi: 10.1038/nmeth.2133.
Epub 2012 Aug 5.
Direct observation of mammalian cell growth and size regulation
Affiliations
- PMID: 22863882
- PMCID: PMC3433595
- DOI: 10.1038/nmeth.2133
Item in Clipboard
Direct observation of mammalian cell growth and size regulation
Nat Methods.
2012 Sep.
Abstract
We introduce a microfluidic system for simultaneously measuring single-cell mass and cell cycle progression over multiple generations. We use this system to obtain over 1,000 h of growth data from mouse lymphoblast and pro-B-cell lymphoid cell lines. Cell lineage analysis revealed a decrease in the growth rate variability at the G1-S phase transition, which suggests the presence of a growth rate threshold for maintaining size homeostasis.
Conflict of interest statement
S.R.M. is a co-founder of Affinity Biosensors and declares competing financial interests.
Figures

Measurement of single cell growth and cell cycle progression. (a) Pressure-driven flow (blue arrows) moves a cell between bypass channels and provides fresh media between measurements. The cell is weighed as it passes through the SMR (red path). Fluorescent signals are measured when the cell passes through the optical window in the bypass reservoir (yellow). (b) Mass (black, measured every 30 seconds) and fluorescent signals from the cell cycle reporters (blue – cdt1 and red – geminim, measured every 30 minutes) were acquired from a L1210 mouse lymphoblast cell over four generations. The dashed box at the arrow zooms-in on signals from one transit through the SMR. Automated feedback between the mass signal and pressure regulators is used to transport the cell back-and-forth between the bypass channels. Following division, one daughter triggers the feedback while the other is swept away. (c) Growth rate versus cell mass obtained by measuring buoyant mass versus time of one cell from the newborn stage through division. Color bar indicates relative cdt1 (red, G1 marker) and geminin (blue, S/G2/M marker) levels. Yellow indicates the G1 to S transition. Error bars at various cell sizes are determined by measuring the growth rate of a fixed (non-growing) cell over a 12 hr period and represent one standard deviation from zero growth rate. Inset: Correlation between the size at G1-S transition and size at the growth slope transition (n = 20). Y-error bars indicate the mass change between the maximum and following minimum cdt1 levels.

Measurement of single cell growth and cell cycle progression. (a) Pressure-driven flow (blue arrows) moves a cell between bypass channels and provides fresh media between measurements. The cell is weighed as it passes through the SMR (red path). Fluorescent signals are measured when the cell passes through the optical window in the bypass reservoir (yellow). (b) Mass (black, measured every 30 seconds) and fluorescent signals from the cell cycle reporters (blue – cdt1 and red – geminim, measured every 30 minutes) were acquired from a L1210 mouse lymphoblast cell over four generations. The dashed box at the arrow zooms-in on signals from one transit through the SMR. Automated feedback between the mass signal and pressure regulators is used to transport the cell back-and-forth between the bypass channels. Following division, one daughter triggers the feedback while the other is swept away. (c) Growth rate versus cell mass obtained by measuring buoyant mass versus time of one cell from the newborn stage through division. Color bar indicates relative cdt1 (red, G1 marker) and geminin (blue, S/G2/M marker) levels. Yellow indicates the G1 to S transition. Error bars at various cell sizes are determined by measuring the growth rate of a fixed (non-growing) cell over a 12 hr period and represent one standard deviation from zero growth rate. Inset: Correlation between the size at G1-S transition and size at the growth slope transition (n = 20). Y-error bars indicate the mass change between the maximum and following minimum cdt1 levels.

Measurement of single cell growth and cell cycle progression. (a) Pressure-driven flow (blue arrows) moves a cell between bypass channels and provides fresh media between measurements. The cell is weighed as it passes through the SMR (red path). Fluorescent signals are measured when the cell passes through the optical window in the bypass reservoir (yellow). (b) Mass (black, measured every 30 seconds) and fluorescent signals from the cell cycle reporters (blue – cdt1 and red – geminim, measured every 30 minutes) were acquired from a L1210 mouse lymphoblast cell over four generations. The dashed box at the arrow zooms-in on signals from one transit through the SMR. Automated feedback between the mass signal and pressure regulators is used to transport the cell back-and-forth between the bypass channels. Following division, one daughter triggers the feedback while the other is swept away. (c) Growth rate versus cell mass obtained by measuring buoyant mass versus time of one cell from the newborn stage through division. Color bar indicates relative cdt1 (red, G1 marker) and geminin (blue, S/G2/M marker) levels. Yellow indicates the G1 to S transition. Error bars at various cell sizes are determined by measuring the growth rate of a fixed (non-growing) cell over a 12 hr period and represent one standard deviation from zero growth rate. Inset: Correlation between the size at G1-S transition and size at the growth slope transition (n = 20). Y-error bars indicate the mass change between the maximum and following minimum cdt1 levels.

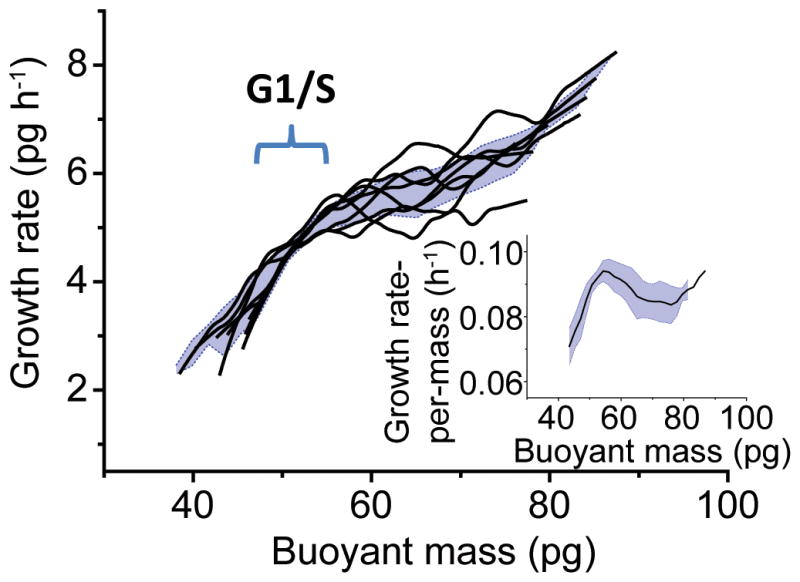
Evidence for a growth rate threshold. (a) Single cell growth rate trajectories (black lines) for a lineage of five L1210 cells. Blue area defines five times the coefficient of variance. Inset: mean (black line) and standard deviation (blue area) of growth rate per unit mass from the lineage. (b) Time at G1/S phase transition versus early G1 growth rate (averaged between first and third hour of growth following division) for L1210 cells. Blue circles: G1/S transition defined by growth transition (n = 49, Pearson’s correlation coefficient = −0.75). Red circles: G1/S transition defined by FUCCI (n = 18, Pearson’s correlation coefficient = −0.60). (c) Single cell growth rate trajectories (black lines) for a lineage of eight FL5.12 cells. Blue area defines five times the coefficient of variance. (d) Time at G1/S phase transition versus early G1 growth rate for FL5.12 cells. G1-S transition is defined by calculating the growth transition point (n = 28, Pearson’s correlation coefficient = −0.72). (e) Coefficient of variance (CV) for buoyant mass (orange) and growth rate (blue) at various points in the cell cycle. n = 49 for L1210 and n = 28 for FL5.12. Error bars represent one standard deviation of the CV from bootstrapping 1,000 times.

Evidence for a growth rate threshold. (a) Single cell growth rate trajectories (black lines) for a lineage of five L1210 cells. Blue area defines five times the coefficient of variance. Inset: mean (black line) and standard deviation (blue area) of growth rate per unit mass from the lineage. (b) Time at G1/S phase transition versus early G1 growth rate (averaged between first and third hour of growth following division) for L1210 cells. Blue circles: G1/S transition defined by growth transition (n = 49, Pearson’s correlation coefficient = −0.75). Red circles: G1/S transition defined by FUCCI (n = 18, Pearson’s correlation coefficient = −0.60). (c) Single cell growth rate trajectories (black lines) for a lineage of eight FL5.12 cells. Blue area defines five times the coefficient of variance. (d) Time at G1/S phase transition versus early G1 growth rate for FL5.12 cells. G1-S transition is defined by calculating the growth transition point (n = 28, Pearson’s correlation coefficient = −0.72). (e) Coefficient of variance (CV) for buoyant mass (orange) and growth rate (blue) at various points in the cell cycle. n = 49 for L1210 and n = 28 for FL5.12. Error bars represent one standard deviation of the CV from bootstrapping 1,000 times.
Evidence for a growth rate threshold. (a) Single cell growth rate trajectories (black lines) for a lineage of five L1210 cells. Blue area defines five times the coefficient of variance. Inset: mean (black line) and standard deviation (blue area) of growth rate per unit mass from the lineage. (b) Time at G1/S phase transition versus early G1 growth rate (averaged between first and third hour of growth following division) for L1210 cells. Blue circles: G1/S transition defined by growth transition (n = 49, Pearson’s correlation coefficient = −0.75). Red circles: G1/S transition defined by FUCCI (n = 18, Pearson’s correlation coefficient = −0.60). (c) Single cell growth rate trajectories (black lines) for a lineage of eight FL5.12 cells. Blue area defines five times the coefficient of variance. (d) Time at G1/S phase transition versus early G1 growth rate for FL5.12 cells. G1-S transition is defined by calculating the growth transition point (n = 28, Pearson’s correlation coefficient = −0.72). (e) Coefficient of variance (CV) for buoyant mass (orange) and growth rate (blue) at various points in the cell cycle. n = 49 for L1210 and n = 28 for FL5.12. Error bars represent one standard deviation of the CV from bootstrapping 1,000 times.

Evidence for a growth rate threshold. (a) Single cell growth rate trajectories (black lines) for a lineage of five L1210 cells. Blue area defines five times the coefficient of variance. Inset: mean (black line) and standard deviation (blue area) of growth rate per unit mass from the lineage. (b) Time at G1/S phase transition versus early G1 growth rate (averaged between first and third hour of growth following division) for L1210 cells. Blue circles: G1/S transition defined by growth transition (n = 49, Pearson’s correlation coefficient = −0.75). Red circles: G1/S transition defined by FUCCI (n = 18, Pearson’s correlation coefficient = −0.60). (c) Single cell growth rate trajectories (black lines) for a lineage of eight FL5.12 cells. Blue area defines five times the coefficient of variance. (d) Time at G1/S phase transition versus early G1 growth rate for FL5.12 cells. G1-S transition is defined by calculating the growth transition point (n = 28, Pearson’s correlation coefficient = −0.72). (e) Coefficient of variance (CV) for buoyant mass (orange) and growth rate (blue) at various points in the cell cycle. n = 49 for L1210 and n = 28 for FL5.12. Error bars represent one standard deviation of the CV from bootstrapping 1,000 times.

Evidence for a growth rate threshold. (a) Single cell growth rate trajectories (black lines) for a lineage of five L1210 cells. Blue area defines five times the coefficient of variance. Inset: mean (black line) and standard deviation (blue area) of growth rate per unit mass from the lineage. (b) Time at G1/S phase transition versus early G1 growth rate (averaged between first and third hour of growth following division) for L1210 cells. Blue circles: G1/S transition defined by growth transition (n = 49, Pearson’s correlation coefficient = −0.75). Red circles: G1/S transition defined by FUCCI (n = 18, Pearson’s correlation coefficient = −0.60). (c) Single cell growth rate trajectories (black lines) for a lineage of eight FL5.12 cells. Blue area defines five times the coefficient of variance. (d) Time at G1/S phase transition versus early G1 growth rate for FL5.12 cells. G1-S transition is defined by calculating the growth transition point (n = 28, Pearson’s correlation coefficient = −0.72). (e) Coefficient of variance (CV) for buoyant mass (orange) and growth rate (blue) at various points in the cell cycle. n = 49 for L1210 and n = 28 for FL5.12. Error bars represent one standard deviation of the CV from bootstrapping 1,000 times.
References
Publication types
MeSH terms
Grants and funding
LinkOut - more resources
Full Text Sources
Other Literature Sources
