

A mathematical model of weight loss under total starvation: evidence against the thrifty-gene hypothesis
- PMID: 22864023
- PMCID: PMC3529354
- DOI: 10.1242/dmm.010009
A mathematical model of weight loss under total starvation: evidence against the thrifty-gene hypothesis
Abstract
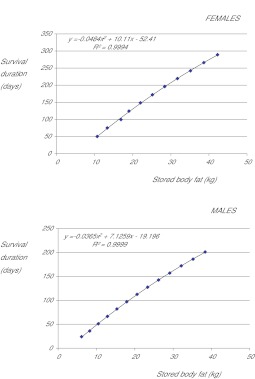
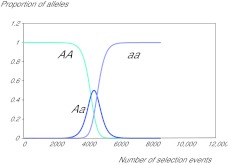
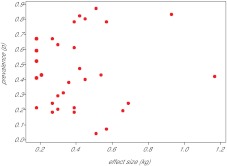
The thrifty-gene hypothesis (TGH) posits that the modern genetic predisposition to obesity stems from a historical past where famine selected for genes that promote efficient fat deposition. It has been previously argued that such a scenario is unfeasible because under such strong selection any gene favouring fat deposition would rapidly move to fixation. Hence, we should all be predisposed to obesity: which we are not. The genetic architecture of obesity that has been revealed by genome-wide association studies (GWAS), however, calls into question such an argument. Obesity is caused by mutations in many hundreds (maybe thousands) of genes, each with a very minor, independent and additive impact. Selection on such genes would probably be very weak because the individual advantages they would confer would be very small. Hence, the genetic architecture of the epidemic may indeed be compatible with, and hence support, the TGH. To evaluate whether this is correct, it is necessary to know the likely effects of the identified GWAS alleles on survival during starvation. This would allow definition of their advantage in famine conditions, and hence the likely selection pressure for such alleles to have spread over the time course of human evolution. We constructed a mathematical model of weight loss under total starvation using the established principles of energy balance. Using the model, we found that fatter individuals would indeed survive longer and, at a given body weight, females would survive longer than males, when totally starved. An allele causing deposition of an extra 80 g of fat would result in an extension of life under total starvation by about 1.1-1.6% in an individual with 10 kg of fat and by 0.25-0.27% in an individual carrying 32 kg of fat. A mutation causing a per allele effect of 0.25% would become completely fixed in a population with an effective size of 5 million individuals in 6000 selection events. Because there have probably been about 24,000 famine events since the evolution of hominins 4 million years ago, there has been ample time even for genes with only very minor impacts on adiposity to move to fixation. The observed polymorphic variation in the genes causing the predisposition to obesity is incompatible with the TGH, unless all these single nucleotide polymorphisms (SNPs) arose in the last 900,000 years, a requirement we know is incorrect. The TGH is further weakened by the observation of no link between the effect size of these SNPs and their prevalence, which would be anticipated under the TGH model of selection if all the SNPs had arisen in the last 900,000 years.
Figures
Similar articles
-
Thrifty genes for obesity, an attractive but flawed idea, and an alternative perspective: the 'drifty gene' hypothesis.Int J Obes (Lond). 2008 Nov;32(11):1611-7. doi: 10.1038/ijo.2008.161. Epub 2008 Oct 14. Int J Obes (Lond). 2008. PMID: 18852699
-
Thrifty genes for obesity and the metabolic syndrome--time to call off the search?Diab Vasc Dis Res. 2006 May;3(1):7-11. doi: 10.3132/dvdr.2006.010. Diab Vasc Dis Res. 2006. PMID: 16784175 Review.
-
The evolution of body fatness: trading off disease and predation risk.J Exp Biol. 2018 Mar 7;221(Pt Suppl 1):jeb167254. doi: 10.1242/jeb.167254. J Exp Biol. 2018. PMID: 29514887
-
Revisiting the evolutionary origins of obesity: lazy versus peppy-thrifty genotype hypothesis.Obes Rev. 2018 Nov;19(11):1525-1543. doi: 10.1111/obr.12742. Epub 2018 Sep 27. Obes Rev. 2018. PMID: 30261552 Review.
-
Evolutionary origins of the obesity epidemic: natural selection of thrifty genes or genetic drift following predation release?Int J Obes (Lond). 2008 Nov;32(11):1607-10. doi: 10.1038/ijo.2008.147. Epub 2008 Oct 14. Int J Obes (Lond). 2008. PMID: 18852700
Cited by
-
An Overview of Murine High Fat Diet as a Model for Type 2 Diabetes Mellitus.J Diabetes Res. 2016;2016:2902351. doi: 10.1155/2016/2902351. Epub 2016 Jul 31. J Diabetes Res. 2016. PMID: 27547764 Free PMC article. Review.
-
Predictive Mathematical Models of Weight Loss.Curr Diab Rep. 2019 Aug 31;19(10):93. doi: 10.1007/s11892-019-1207-5. Curr Diab Rep. 2019. PMID: 31473830 Review.
-
Obesity: an evolutionary context.Life Metab. 2022 Apr 29;1(1):10-24. doi: 10.1093/lifemeta/loac002. eCollection 2022 Aug. Life Metab. 2022. PMID: 36394061 Free PMC article. Review.
-
Gut microbe-derived lactic acid optimizes host energy metabolism during starvation.bioRxiv [Preprint]. 2025 May 28:2025.05.27.656452. doi: 10.1101/2025.05.27.656452. bioRxiv. 2025. PMID: 40502158 Free PMC article. Preprint.
-
Mind the gap: race/ethnic and socioeconomic disparities in obesity.Curr Diab Rep. 2015 Nov;15(11):95. doi: 10.1007/s11892-015-0666-6. Curr Diab Rep. 2015. PMID: 26377742 Free PMC article. Review.
References
-
- Afolabi P. R., Jahoor F., Jackson A. A., Subbs J., Johnstone A. M., Faber P., Lobley G., Gibney E., Elia M. (2007). The effect of total starvation and very low energy diet in lean men on kinetics of whole body protein and five hepatic secretry proteins. Am. J. Physiol. Endocrinol. Metab. 293, E1580–E1589 - PubMed
-
- Allison D. B., Kaprio J., Korkeila M., Koskenvuo M., Neale M. C., Hayakawa K. (1996). The heritability of BMI among an international sample of monozygotic twins reared apart. Int. J. Obes. Relat. Metab. Disord. 20, 501–506 - PubMed
-
- Alpert S. S. (2005). A limit on the energy transfer rate from the human fat store in hypophagia. J. Theor. Biol. 233, 1–13 - PubMed
-
- Alpert S. S. (2007). The cross-sectional and longitudinal dependence of the resting metabolic rate on the fat-free mass. Metabolism 56, 363–372 - PubMed
-
- Altun G., Akansu B., Altun B. U., Azmak D., Yilmaz A. (2004). Deaths due to hunger strike: post-mortem findings. Forensic Sci. Int. 146, 35−38 - PubMed
Publication types
MeSH terms
LinkOut - more resources
Full Text Sources
Medical
Molecular Biology Databases
Miscellaneous
