. 2012 Oct 1;303(7):H809-24.
doi: 10.1152/ajpheart.01098.2011. Epub 2012 Aug 3.

Independent and interactive effects of preload and afterload on the pump function of the isolated lymphangion

Affiliations

Independent and interactive effects of preload and afterload on the pump function of the isolated lymphangion

Joshua P Scallan et al. Am J Physiol Heart Circ Physiol. .

Abstract

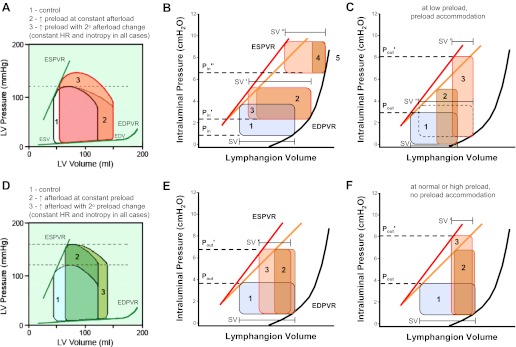
We tested the responses of single, isolated lymphangions to selective changes in preload and the effects of changing preload on the response to an imposed afterload. The methods used were similar to those described in our companion paper. Step-wise increases in input pressure (P(in); preload) over a pressure range between 0.5 and 3 cmH(2)O, at constant output pressure (P(out)), led to increases in end-diastolic diameter, decreases in end-systolic diameter, and increases in stroke volume. From a baseline of 1 cmH(2)O, P(in) elevation by 2-7 cmH(2)O consistently produced an immediate fall in stroke volume that subsequently recovered over a time course of 2-3 min. Surprisingly, this adaptation was associated with an increase in the slope of the end-systolic pressure-volume relationship, indicative of an increase in contractility. Lymphangions subjected to P(out) levels exceeding their initial ejection limit would often accommodate by increasing diastolic filling to strengthen contraction sufficiently to match P(out). The lymphangion adaptation to various pressure combinations (P(in) ramps with low or high levels of P(out), P(out) ramps at low or intermediate levels of P(in), and combined P(in) + P(out) ramps) were analyzed using pressure-volume data to calculate stroke work. Under relatively low imposed loads, stroke work was maximal at low preloads (P(in) ∼2 cmH(2)O), whereas at more elevated afterloads, the optimal preload for maximal work displayed a broad plateau over a P(in) range of 5-11 cmH(2)O. These results provide new insights into the normal operation of the lymphatic pump, its comparison with the cardiac pump, and its potential capacity to adapt to increased loads during edemagenic and/or gravitational stress.


Figures

Fig. 1.
Fig. 1.
Response of an isolated lymphangion to short-lasting, step-wise elevations in input pressure (Pin). A: recording showing spontaneous lymphangion contractions at six different levels of preload (Pin), starting from 0.5 cmH2O, with output pressure (Pout) held constant. Pin was elevated in sequential steps (no return to baseline) and maintained for ∼5–10 contractions (cf. Fig. 2). The schematic diagram of the preparation shown in the inset shows where pressures and diameter were measured. The blue trace shows Pin (in cmH2O), the red trace shows Pout (in cmH2O), and the black trace shows intraluminal pressure (PL; in cmH2O), measured by the servo-null micropipette. End-diastolic diameter (EDD) was measured at the end of diastole, and end-systolic diameter (ESD) was measured at the peak of systole. B: pressure-volume (P-V) plots of data from A, showing three complete contractions at each Pin level; each set of contractions is color coded. Volume was calculated as described in methods. Stroke volume (SV) was maximal at Pin = 3 cmH2O in this vessel. Points a–d were used to quantify the loops, with point a showing the end of diastole, point b showing peak systolic pressure, point c showing the end of systole, and point d showing the minimal pressure during the contraction cycle. C: summary P-V diagram constructed from measurements of points a–d for 8 vessels. The solid and dotted black lines in B and C approximate the end-systolic pressure-volume relationship (ESPVR) and end-diastolic pressure-volume relationship (EDPVR), respectively. EDVPR was curvilinear. ESPVR was curvilinear for the lower range of Pin levels but linear over the higher range of Pin levels.
Fig. 2.
Fig. 2.
Time course of responses to sustained, step-wise Pin elevation. A: recording showing the pressure and diameter responses that occurred in response to a sustained Pin step. Initially, Pin was set to 0.5 cmH2O and Pout to 1 cmH2O (to prevent forward flow). Pin was then increased in steps to 1, 5, 8, and 12 cmH2O for 5 min at each level, returning to the control level after each step (for this vessel, Pin was elevated using the reservoir system); Pout was held constant. Time-dependent, secondary changes in EDD, amplitude (AMP), and ESV occurred that were not evident in Fig. 1 (denoted by arrow for the first Pin step). In this particular vessel, the servo-null pipette was positioned closer to the input valve than in Fig. 1 so that PL was closer to Pin than Pout. *Diameter tracking artifact. The third step in this recording is available as a movie (see Supplemental Movie S1, available at the American Journal of Physiology-Heart and Circulatory Physiology website). B and C: summary analysis of AMP and frequency (FREQ) changes over time for the protocol used in A plotted as a function of contraction number. Data are means ± SE. Time is relative to the Pin step. The color coding scheme is same as in Fig. 1. The open symbols indicate points that were significantly different from the point at time 0 (immediately after the respective Pin step) using ANOVA followed by Dunnett's test. The color denotations in C apply to both B and C. D: P-V plot showing selected contractions from the recording in A. The blue loops correspond to three contractions at the control Pin level (marked by the blue dot in A). Each black loop corresponds to the first contraction after the Pin step (black dot in A), and each gold loop corresponds to the contraction in which the minimal value of ESV was first reached (gold dot in A). The dotted black line approximates EDPVR, whereas the dotted lines approximate ESPVR for the initial contraction and for the contraction when a steady-state AMP was reached (ESPVR′). E: summary plot showing the average shape of P-V loops from seven vessels at various levels of Pin (afterload was held at the baseline level). Because of the unusual loop shapes in several vessels, the six standard points described in the companion paper (10) were measured for each P-V loop. The color scheme is similar to that used in Fig. 1, B and C. The open symbols represent contractions immediately after a Pin step, whereas the filled symbols represent contractions when a steady-state response had been achieved. The black and gold lines were fitted to the ESPVR (solid lines) and EDPVR (dotted lines) for the initial and steady-state time points, respectively. A modified hyperbolic function was used to fit ESPVR, whereas an exponential function was used to fit EDPVR. The steady-state curves significantly differed from the initial curves for both ESPVR (P < 0.0001) and EDPVR (P < 0.05).
Fig. 3.
Fig. 3.
Summary of lymphangion contraction parameters as a function of Pin obtained using 5-min step-wise increases in Pin with Pout held constant at 1 cmH2O. A: AMP. B: normalized (norm) AMP. C: SV. D: EDD. E: ESD. F: tone. G: ejection fraction (EF). H: FREQ. I: fractional pump flow (FPF). Each point represents the mean ± SE. Filled black symbols represent the initial response (within 0.5 min after the pressure step), open symbols represent steady-state responses (4.5 min after the pressure step), and gray symbols indicate baseline values. n = 7 vessels except for F, where n = 4 and valid calculations of tone could not be calculated at some Pin levels for three vessels. *P < 0.05 between the 0.5- and 4.5-min time points using Bonferroni's post hoc test after two-way ANOVA.
Fig. 4.
Fig. 4.
Response to ramp-wise Pin elevation under conditions where forward flow is minimized. A: response of an isolated lymphangion to a ramp-wise increase in Pin from 2 to 16 cmH2O with Pout held constant at 2 cmH2O. The long pause before contractions resumed after the end of the ramp (time: 162–164 min) is consistent with rate-sensitive inhibition (8). *Brief simultaneous pulse of Pout to 12 cmH2O to check the servo-null calibration. The dotted horizontal line shows the maximal EDD for reference (obtained at Pin = 16 cmH2O). Valve position traces show the relative positions of the input (blue trace) and output (red trace) valve leaflets, where 1 = open and 0 = closed (for tracking details, see methods). B: response of the same lymphangion in A to a combined ramp-wise increase in Pin and Pout from 2 to 16 cmH2O. For reference, the dotted horizontal line shows the maximal EDD (obtained at Pin = Pout ∼ 8 cmH2O); subsequently, a slight constriction (arrow) occurred at higher levels of Pin and Pout. C: P-V relationship for the contractions during the Pin ramp in A. The blue loops correspond to three contractions at the control Pin level, and the color-coded loops correspond to the contractions shown in the corresponding colors of the trace in A. D: P-V relationship for the contractions shown in the first half of the Pin ramp in B. The blue loops indicate five contractions at the control Pin level, and the color-coded loops correspond to the corresponding colors of the trace in B. Only the contractions for the first half of the combined ramp are shown so that the ranges of PL values are matched between C and D. The solid and dotted black lines in C and D define ESPVR and EDPVR, respectively. The slight leftward bowing of the ESPVR in C is discussed in the text.
Fig. 5.
Fig. 5.
Effect of preload on the ability of an isolated lymphangion to pump against a ramp-wise elevation in Pout. A: recording showing the response of a single lymphangion to multiple Pout ramps, each beginning at a different level of Pin. The inset shows the expanded time scale for ramp 3. With each contraction during the ramp, the PL pulse amplitude increased to match Pout, until the ejection limit was reached (Plimit); after that point, the output valve failed to open during systole until the ramp was terminated. The output valve record is the top trace, and the gaps during the ramps denote the periods in which ejection fails. B: contraction AMP for each contraction cycle during each Pout ramp in A plotted as a single point against the instantaneous Pout level. Each curve represents the data set obtained for one Pout ramp at a given level of Pin. The family of curves is therefore analogous to a set of force-velocity curves (force vs. afterload) at different levels of preload. The color coding is similar to the scheme used in Fig. 1. C: difference between Plimit and Pin plotted as a function of Pin (filled circles) from the recording in A. The points were fit to a third-order polynomial. For comparison, the contraction AMP (averaged over at least 3 contraction cycles) before the beginning of each Pout ramp was plotted as a function of Pin (open circles; fit to a power function).
Fig. 6.
Fig. 6.
Stroke work for the various protocols calculated from the area of the P-V loops for individual contractions. A: protocol 3. B: protocol 2. C: protocol 4. D: protocol 5. See methods for protocol descriptions. A: effects of elevated Pout at two levels of Pin. B: effects of Pin at two levels of Pout. *Significantly different from control (Pin = 1 cmH2O except in B, where Pout = 1 cmH2O) using Dunnett's post hoc tests; significantly different from control (Pin = 3 cmH2O in A and Pout = 3 cmH2O in B) using Dunnett's post hoc tests.
Fig. 7.
Fig. 7.
Example of a lymphangion that exhibited preload accommodation when contraction strength was insufficient to pump against an elevated afterload. A: recordings of pressure, diameter, and valve position of an isolated lymphangion in response to a step-wise Pout increase to a relatively high value (8 cmH2O). Control contractions at equal levels of Pin and Pout are shown in blue. After the Pout step, the output valve closed and remained closed for ∼10 contractions. Initially, the lymphangion only developed a peak systolic pressure of ∼3.5 cmH2O. PL pulse amplitude began to subsequently increase (to ∼6 cmH2O), but this was insufficient to achieve ejection as the output valve continued to remain closed during systole. The input valve then closed (arrow 1), after which diastolic volume and pressure increased. At time = 104 min, ejection resumed as the resulting peak systolic pressure exceeded Pout. Subsequently, contractions became stronger, PL pulse amplitude increased, and ejection continued as diastolic pressure returned toward control levels. At arrow 2, diastolic PL essentially returned to control because the input valve began to open and close with each contraction cycle (indicating that PL equalized with Pin). After Pout returned to the control level, contraction AMP (green trace) remained elevated (compared with its initial level before the Pout step), suggesting that contraction strength continued to remain elevated. B: P-V loop analysis for the first half of the trace in A. The blue loops are control contractions, corresponding to the blue portion of trace in A. The other loops correspond to the multicolored portion of the trace labeled “B,” with the time of the loops indicated by the color of the trace. The line labeled ESPVR was drawn from ESV of the control loops to ESV of the final loops (i.e., when EDP was maximal) for this portion of the trace. The lines for ESPVR′ and EDVPR are redrawn from the plot in C. C: P-V loop analysis for the second half of the trace in A. The blue loops show the control contractions for reference (corresponding to the blue portion of the trace in A). The other loops correspond to the multicolored portion of the trace in A, with the time of the loops indicated by the color of the trace. The green traces show several loops immediately after the return of Pout to its control level (corresponding to the green portion of the trace in A). The line representing EDPVR was drawn through the diastolic points for the yellow portion of the trace and then also overlaid on the curve in B for reference. The line representing ESPVR′ was drawn from the ESV for the control loops and ESV for the final loops for the yellow portion of the trace and then also overlaid on the curves in B. The curve labeled “passPVR” is the passive P-V relationship obtained with a simultaneous Pin + Pout ramp in Ca2+-free physiological saline solution at the end of the experiment.
Fig. 8.
Fig. 8.
Schematic diagram comparing the responses of the heart and the isolated lymphangion to changes in preload (A–C) and afterload (D–F). A: response of the cardiac ventricle to increased preload. The control cardiac cycle is loop 1 (black outline). In response to an increase in preload, the isolated heart adjusts to loop 2 (on the second and subsequent contractions, given the stated conditions). The intact heart subsequently adjusts to loop 3 on the third contraction because of a secondary increase in afterload. B: response of the lymphangion to preload elevation (Pin to P′out),). The P-V loop initially contracts (loop 1 to loop 2) and then subsequently expands to loop 3 over the course of 5–20 contractions such that SV′ > SV. At much higher levels of preload (P″out),), the same adaptation occurs, but the resulting SV is reduced from the control value (SV″ < SV). C: if afterload is elevated within a certain range, the P-V loop narrows (loop 1 to loop 2), but the isolated lymphangion can subsequently accommodate by increasing diastolic filling and EDP to increase contraction strength (loop 2 to loop 3). See text for discussion. D: the isolated heart responds to an increase in aortic pressure by shifting from loop 1 to loop 2, with SV decreasing in proportion to the increase in ESV. The intact heart undergoes a subsequent increase in preload (loop 2 to loop 3) due to incomplete emptying of the ventricle; over a longer time interval, the Anrep effect may also be invoked to produce a modest decrease in ESV (not shown). E: the response of the lymphangion to afterload elevation (Pout to P′out) involves an initial narrowing of the P-V loop (loop 1 to loop 2) followed by subsequent expansion (loop 2 to loop 3) as an intrinsic increase in contractility occurs. ESPVR shifts to a higher slope. F: if afterload is elevated within a certain range, the lymphangion is initially unable to eject and the P-V loop narrows (loop 1 to loop 2); subsequently, the strength of contraction increases (loop 2 to loop 3) until ejection resumes. The results shown in E and F are based in part on data from the companion paper (10). A and D were modified from R. Klabunde (http://www.cvphysiology.com/CardiacFunction/CF025.htm).

References

    1. Akl TJ, Nagai T, Cote G, Gashev AA. Mesenteric flow in adult and aged rats. Am J Physiol Heart Circ Physiol 301: H1828–H1840, 2011 - PMC - PubMed
    1. Aukland K. Why don't our feet swell in the upright position? News Physiol Sci 9: 214–219, 1994
    1. Benoit JN, Zawieja DC, Goodman AH, Granger HJ. Characterization of intact mesenteric lymphatic pump and its responsiveness to acute edemagenic stress. Am J Physiol Heart Circ Physiol 257: H2059–H2069, 1989 - PubMed
    1. Bohlen HG, Gasheva OY, Zawieja DC. Nitric oxide formation by lymphatic bulb and valves is a major regulatory component of lymphatic pumping. Am J Physiol Heart Circ Physiol 301: H1897–H1906, 2011 - PMC - PubMed
    1. Bohlen HG, Wang W, Gashev A, Gasheva O, Zawieja D. Phasic contractions of rat mesenteric lymphatics increase basal and phasic nitric oxide generation in vivo. Am J Physiol Heart Circ Physiol 297: H1319–H1328, 2009 - PMC - PubMed

Publication types