. 2012 Sep 15;72(18):4642-51.
doi: 10.1158/0008-5472.CAN-11-3775. Epub 2012 Aug 3.

NFAT1 supports tumor-induced anergy of CD4(+) T cells

Affiliations

NFAT1 supports tumor-induced anergy of CD4(+) T cells

Brian T Abe et al. Cancer Res. .

Abstract

Cancer cells express antigens that elicit T cell-mediated responses, but these responses are limited during malignant progression by the development of immunosuppressive mechanisms in the tumor microenvironment that drive immune escape. T-cell hyporesponsiveness can be caused by clonal anergy or adaptive tolerance, but the pathophysiological roles of these processes in specific tumor contexts has yet to be understood. In CD4+ T cells, clonal anergy occurs when the T-cell receptor is activated in the absence of a costimulatory signal. Here we report that the key T-cell transcription factor NFAT mediates expression of anergy-associated genes in the context of cancer. Specifically, in a murine model of melanoma, we found that cancer cells induced anergy in antigen-specific CD4+ T-cell populations, resulting in defective production of several key effector cytokines. NFAT1 deficiency blunted the induction of anergy in tumor antigen-specific CD4+ T cells, enhancing antitumor responses. These investigations identified tumor-induced T-cell hyporesponsiveness as a form of clonal anergy, and they supported an important role for CD4+ T-cell anergy in driving immune escape. By illustrating the dependence of tumor-induced CD4+ T-cell anergy on NFAT1, our findings open the possibility of targeting this transcription factor to improve the efficacy of cancer immunotherapy or immunochemotherapy.


Conflict of interest statement

Disclosure of Potential Conflicts of Interest

The authors declare no conflict of interest.

Figures
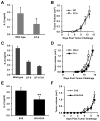
Figure 1
Figure 1. B16-OVA melanoma cells cause antigen-specific hyporesponsiveness in CD4+ T cells
B6.Pl-Thy1a mice were challenged with 5×10⁵ B16-OVA cells followed by adoptive transfer of 5×10⁶ naïve CD4+ T cells from C57Bl/6 or OT-II mice (A) or in vitro differentiated OT-II Th1 cells (C). Transferred cells were re-isolated from DLN and stimulated in vitro with plate-bound anti-CD3 and anti-CD28. IL-2 production was measured by ELISA. Results are presented as mean±SEM from 2–4 mice. *P<0.05. B and D. Tumor volumes were calculated from perpendicular diameters recorded every 1–2 days. Results are presented as mean±SEM from 5–9 mice. E. B6.Pl-Thy1a mice were challenged with 5×10⁵ B16 or B16-OVA cells and adoptively transferred with 5×10⁶ OT-II CD4+ T cells. Transferred cells were re-isolated and stimulated with anti-CD3 and anti-CD28. IL-2 was measured by ELISA. F. Tumor volumes were calculated from perpendicular diameters recorded daily. Results are presented as mean±SEM from 13–15 mice. **P<0.01.
Figure 2
Figure 2. B-16-OVA melanoma induces anergy in antigen specific CD4+ T cells in the tumor DLN
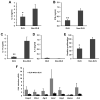
A–D. OT-II mice were challenged with 5×10⁵ B16-OVA cells. Ten to twelve days post tumor challenge, CD4+ T cells were isolated from the DLN and distal non-DLN and stimulated with OVA323–339 peptide-loaded splenocytes. IL-2, IFNγ, IL-17 and IL-4 production were measured by ELISA. Results are presented as mean+SEM from 3–5 mice. *P<0.05; **P<0.01. E. Cell proliferation was also measured in cells stimulated with anti-CD3 and anti-CD28 by BrdU incorporation. Results from are presented as mean±SEM from 4 independent experiments. F. CD4+ T cells isolated from DLN and non-DLN of the B16-OVA challenged OT-II mice (106 B16 cells per mouse) were lysed after isolation for extraction of RNA. cDNA was synthesized and levels of anergy-associated genes transcripts were measured by real-time PCR. Results, expressed as fold induction of the expression of anergy-associated genes in T cells from DLN and non-DLN compared to T cells from control non-tumor bearing mice, are presented as mean±SEM from 3 to 4 independent experiments.
Figure 3
Figure 3. B-16-OVA melanoma induces anergy in tumor-infiltrating antigen specific CD4+ T cells
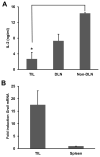
A. CD4+ T cells from DLN, non-DLN and tumor infiltrating lymphocytes (TIL) were isolated from B16-OVA tumor bearing (5×10⁵ cells) OT-II mice and stimulated with anti-CD3 and anti-CD28 antibodies. IL-2 production was measured by ELISA and is presented as mean±SEM from 3 independent experiments. *P<0.05 (TIL vs. non-DLN). B. CD4+ TIL and T cells from spleens of B16-OVA bearing mice were isolated and immediately lysed for RNA extraction. Grail message levels were detected by real-time PCR. Results are presented as mean±SEM from 3 mice.
Figure 4
Figure 4. Nfat1−/− OT-II CD4+ T cells are resistant to tumor-induced anergy
A–C. CD4+ T cells were isolated from the tumor DLN and non-DLN of B16-OVA bearing Nfat1+/+ or Nfat1−/− OT-II mice and stimulated with OVA323–339 peptide-loaded splenocytes. IL-2, IFNγ and IL-17 production were measured by ELISA Results are presented as mean±SEM from 4–5 independent experiments. *P<0.05; **P<0.001. D. CD4+ T cells from the B16-OVA tumor DLN and non-DLN were isolated from Nfat1+/+ and Nfat1−/−/OT-II mice and immediately lysed for extraction of RNA. Transcript levels were measured by real-time PCR. Results are presented as mean±SEM from 3 independent experiments.
Figure 5
Figure 5. Anergy-resistant Nfat1−/−OT-II T cells delay tumor growth
A. 5×10⁵ B16-OVA cells were injected subcutaneously into TCR-transgenic Nfat1+/+OT-II and Nfat1−/−OT-II mice. 10 days post-tumor challenge tumors were excised from Nfat1+/+OT-II and Nfat1−/−OT-II mice and weighed. Results are mean±SEM of 2 groups of 6 mice. *P<0.05. B. B16-OVA cells were injected subcutaneously into Nfat1+/+OT-II and Nfat1−/−OT-II mice. Tumor volumes were calculated from perpendicular diameters recorded every 1–2 days. Results are presented as mean±SEM from 5–9 mice. *P<0.05; **P<0.01; ***P<0.001. C. C57Bl/6 mice were injected with 5×10⁵ B16-OVA cells and then adoptively transferred with PBS or 5×10⁶ in vitro differentiated Nfat1+/+ or Nfat1−/− OT-II Th1 cells. Tumor volumes were calculated from perpendicular diameters recorded every 1–2 days. Results are presented as mean±SEM from 3 groups of 5 mice. D. 5×10⁵ B16-OVA cells were injected subcutaneously into Nfat1+/+ or Nfat1−/− mice. Tumor volumes were calculated from perpendicular diameters recorded every 1–2 days. Results are presented as mean±SEM from two groups of 5–6 mice. E. 5×10⁵ B16-OVA cells were injected subcutaneously into the flanks B6.129S2-Cd8atm1Mak/J mice followed by intravenous transfer of 5×10⁶ Nfat1+/+ or Nfat1−/− OT-II T cells. Tumor volumes were calculated from perpendicular diameters recorded every 1–2 days. Results are representative of one of two independent experiments and are presented as mean±SEM of data obtained from 3 mice per condition.
Figure 6
Figure 6. Anergy-resistant Nfat1−/− T cells delay TC-1 tumor growth
A. C57Bl/6 mice were vaccinated with by intraperitoneal injection of 106 apoptotic TC-1 cells (one injection per week for two weeks), followed by subcutaneous injection of 5×10⁵ TC-1 cells. Control animals were injected with equal volumes of PBS prior to receiving the live tumor cells. Tumor volumes were calculated from perpendicular diameters recorded every 1–2 days. Results are presented as mean±SEM of data obtained from 3 mice. B. B6.Nfat1+/+ and B6.Nfat1−/− mice were vaccinated as above, followed by subcutaneous injection of 5×10⁵ TC-1 cells. Tumor volumes were calculated from perpendicular diameters recorded every 1–2 days. Results are presented as mean±SEM of data obtained from four mice analyzed in two independent experiments.*P<0.05.

References

    1. Rabinovich GA, Gabrilovich D, Sotomayor EM. Immunosuppressive strategies that are mediated by tumor cells. Annu Rev Immunol. 2007;25:267–96. - PMC - PubMed
    1. Sawanobori Y, Ueha S, Kurachi M, Shimaoka T, Talmadge JE, Abe J, et al. Chemokine-mediated rapid turnover of myeloid-derived suppressor cells in tumor-bearing mice. Blood. 2008;111:5457–66. - PubMed
    1. Enk AH, Jonuleit H, Saloga J, Knop J. Dendritic cells as mediators of tumor-induced tolerance in metastatic melanoma. Int J Cancer. 1997;73:309–16. - PubMed
    1. Driessens G, Kline J, Gajewski TF. Costimulatory and coinhibitory receptors in anti-tumor immunity. Immunol Rev. 2009;229:126–44. - PMC - PubMed
    1. Curiel TJ, Coukos G, Zou L, Alvarez X, Cheng P, Mottram P, et al. Specific recruitment of regulatory T cells in ovarian carcinoma fosters immune privilege and predicts reduced survival. Nat Med. 2004;10:942–9. - PubMed

Publication types

Substances