. 2012 Oct;30(10):2297-308.
doi: 10.1002/stem.1192.

Dual lineage-specific expression of Sox17 during mouse embryogenesis

Affiliations

Dual lineage-specific expression of Sox17 during mouse embryogenesis

Eunyoung Choi et al. Stem Cells. 2012 Oct.

Abstract

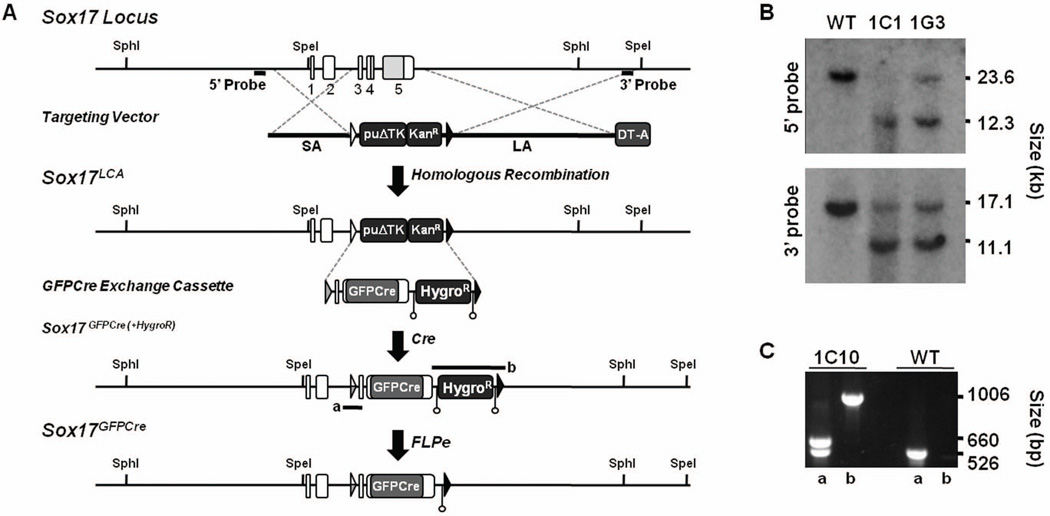
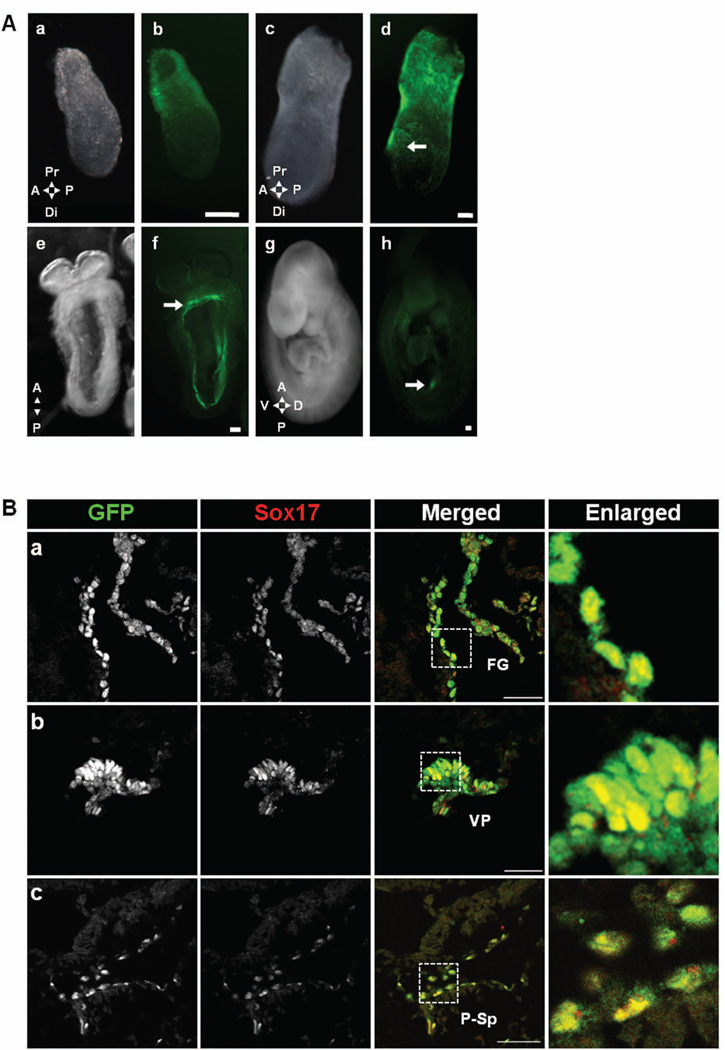
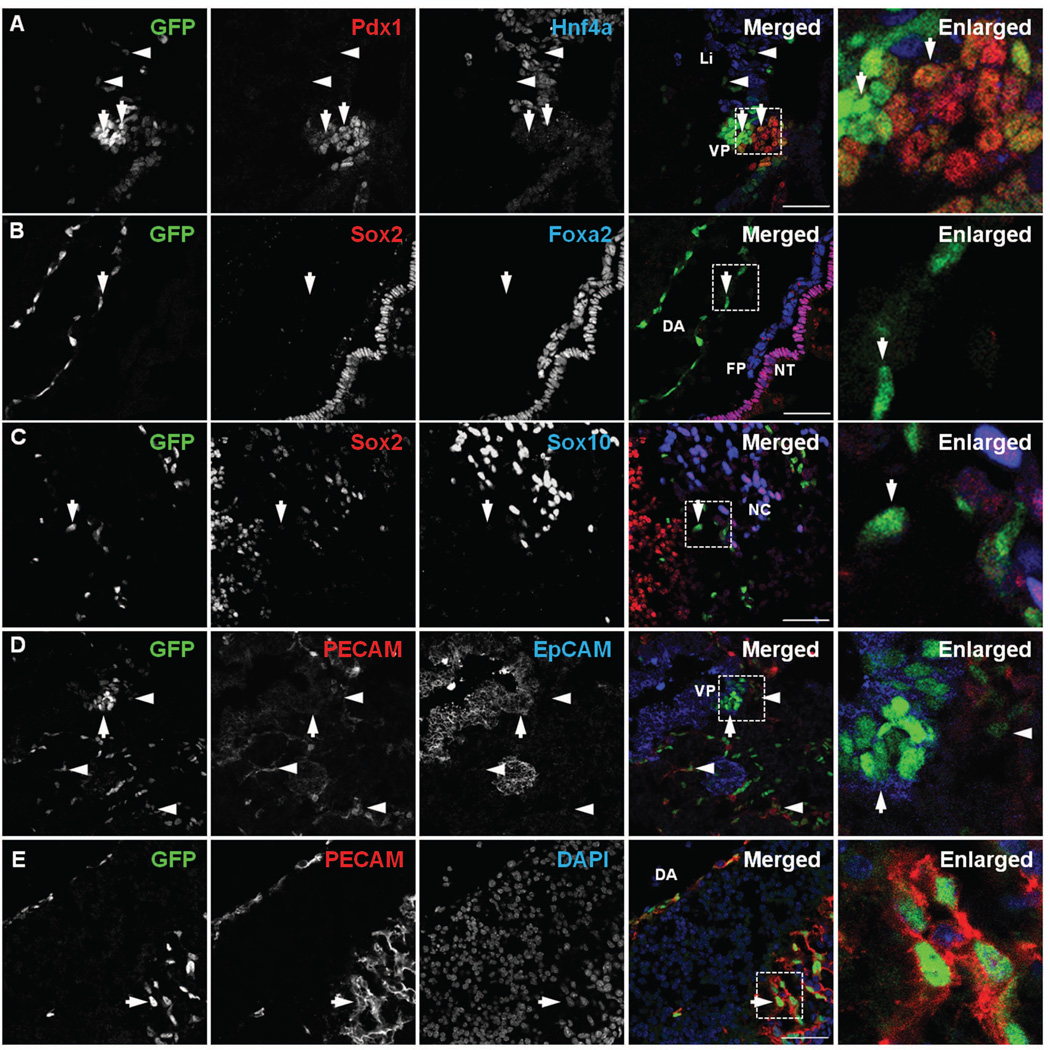
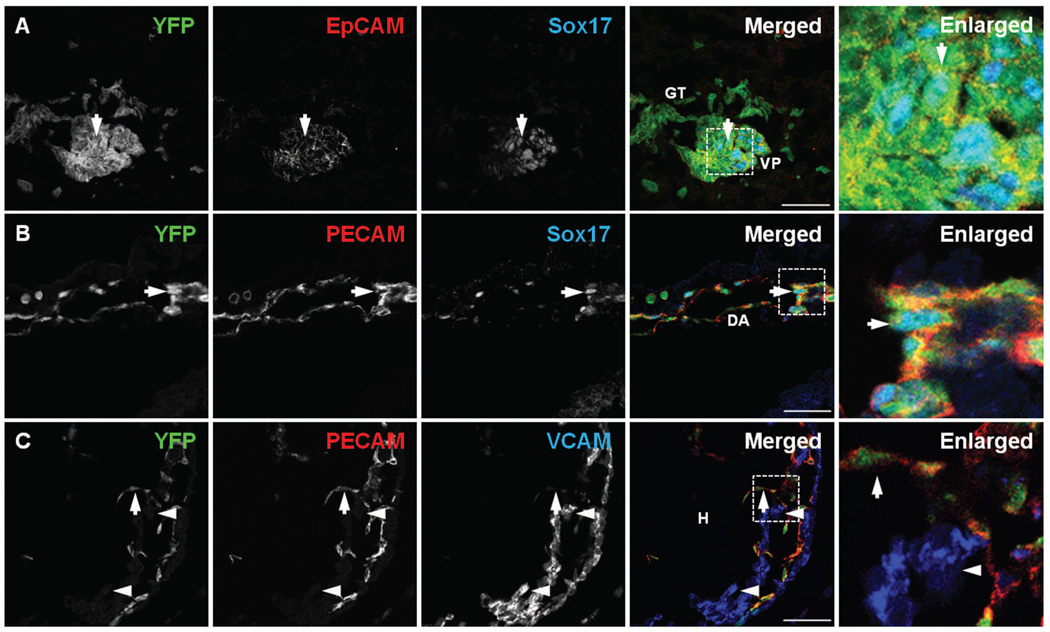
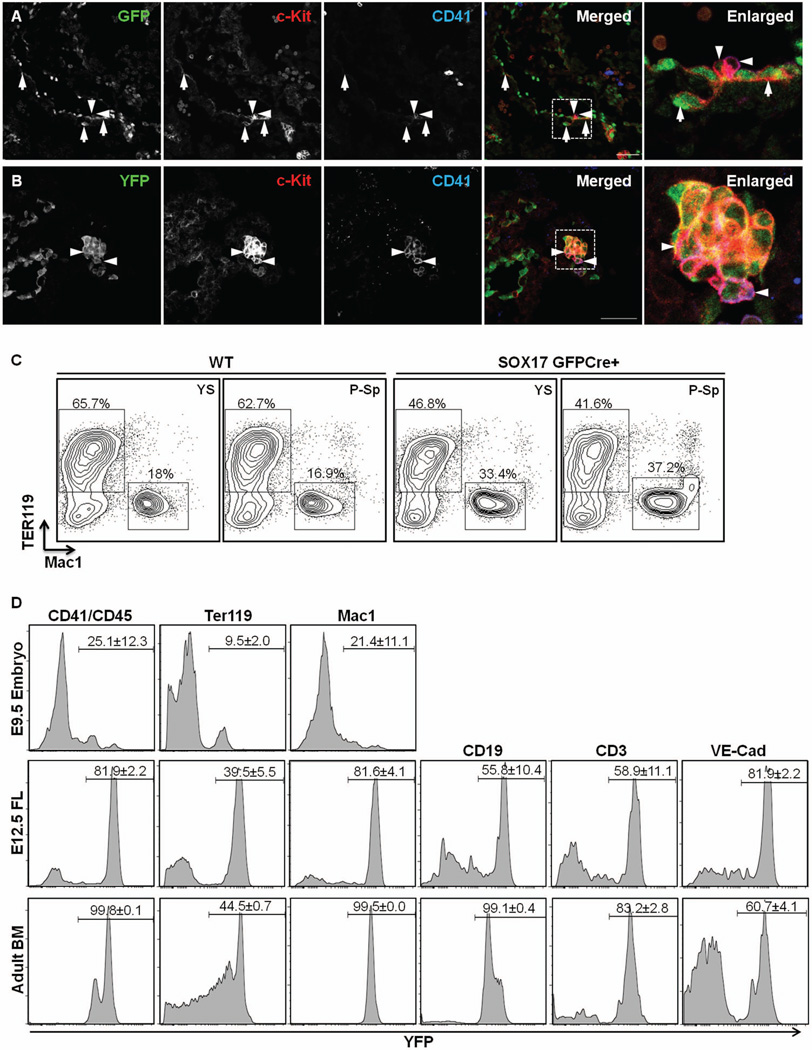
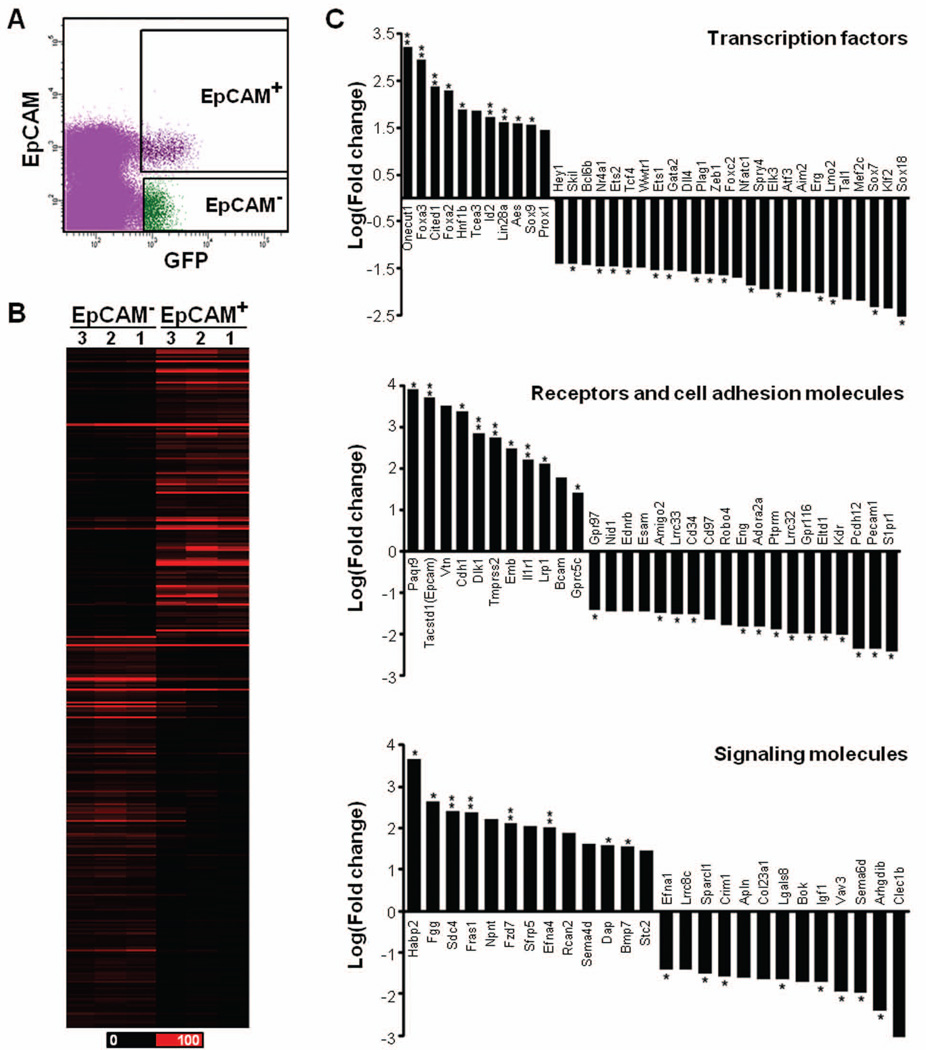
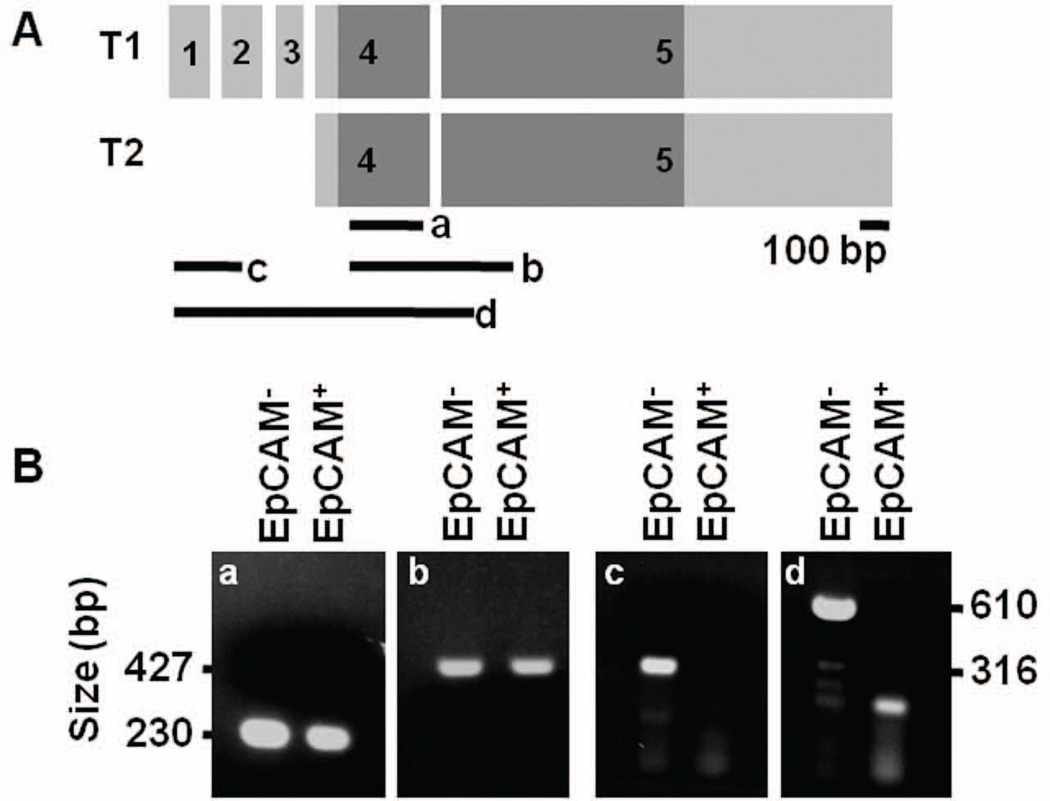
Sox17 is essential for both endoderm development and fetal hematopoietic stem cell (HSC) maintenance. While endoderm-derived organs are well known to originate from Sox17-expressing cells, it is less certain whether fetal HSCs also originate from Sox17-expressing cells. By generating a Sox17(GFPCre) allele and using it to assess the fate of Sox17-expressing cells during embryogenesis, we confirmed that both endodermal and a part of definitive hematopoietic cells are derived from Sox17-positive cells. Prior to E9.5, the expression of Sox17 is restricted to the endoderm lineage. However, at E9.5 Sox17 is expressed in the endothelial cells (ECs) at the para-aortic splanchnopleural region that contribute to the formation of HSCs at a later stage. The identification of two distinct progenitor cell populations that express Sox17 at E9.5 was confirmed using fluorescence-activated cell sorting together with RNA-Seq to determine the gene expression profiles of the two cell populations. Interestingly, this analysis revealed differences in the RNA processing of the Sox17 mRNA during embryogenesis. Taken together, these results indicate that Sox17 is expressed in progenitor cells derived from two different germ layers, further demonstrating the complex expression pattern of this gene and suggesting caution when using Sox17 as a lineage-specific marker.


Conflict of interest statement

Disclosure of potential conflicts of interest

No potential conflicts of interest.

Figures

Figure 1
Figure 1. Generation the Sox17GFPCre allele
A) Diagram of the Sox17 locus, targeting vector, Sox17LCA allele, GFPCre exchange cassette, Sox17GFPCre(+HygroR), and Sox17GFPCre allele. A targeting vector for the mouse Sox17 gene was constructed where sequence including exons 3 to 5, which contain the coding region of Sox17, was replaced with a puromycin resistance-Δ-thymidine kinase fusion gene (puΔTK) and an EM7-driven kanamycin resistance gene (KanR) flanked by lox66 (open triangle) and lox2272 (black triangle) sites. The GFPCre exchange cassette was flanked by lox71 (grey triangle) and lox2272 sites and contained a PGK-driven hygromycin resistance gene (HygroR) flanked by FRT sites (open circles). Following exchange into Sox17LCA-containing mouse ES cells by RMCE, mice containing the Sox17GFPCre(+HygroR) allele were bred with FLPe-expressing transgenic mice, thereby generating the final Sox17GFPCre allele. PCR amplifications for 5’ and 3’ screening of Sox17GFPCre(+HygroR) allele depicted as a and b. SA, short arm. LA, long arm. B) Southern blot analysis of genomic DNA from puromycin-resistant Sox17LCA ES cells. DNA was digested with SphI or SpeI and hybridized with a 5’ or 3’ probe as indicated in panel A. Clones 1C1 and 1G3 were correctly targeted by presence of a 12.3 kb and 11.1 kb band on the 5’ and 3’ ends, respectively. Clone 1G3 was used for RMCE. C) PCR screening of Sox17GFPCre(+HygroR) exchanged clones. The proper exchange of clone 1C10 was identified by 660 and 1,006 basepair (bp) bands on the 5’ and 3’ ends, respectively.
Figure 2
Figure 2. Expression pattern of Sox17GFPCre/+ during development
A) GFPCre expression was observed from E6.5 to E9.5 in Sox17GFPCre/+ embryos. At E6.5, GFPCre was observed only in the extra-embryonic region (a&b). Conversely, at E7.5, it was seen in the embryonic region (c&d), specially the definitive endoderm area (arrow). At E8.5, GFPCre was observed in the gut tube area (e&f) with expression in the foregut region marked (arrow). At E9.5, the expression was diminished in the gut (g&h) but was still seen in the ventral pancreatic bud (arrow). Scale bar = 100 µm. Anterior (A), posterior (P), proximal (Pr), distal (Di), dorsal (D), ventral (V). B) Immunolabeling revealed co-localization of both GFPCre and Sox17 in E8.5 and E9.5 Sox17GFPCre/+ mouse embryos. At E8.5, GFPCre and Sox17 were co-expressed in the foregut endoderm (a) and at E9.5 in the ventral pancreatic bud (b) and the para-aortic splanchnopleural area (c). White boxed areas depict regions enlarged. Scale bar = 50 µm. Foregut (FG), ventral pancreatic bud (VP), para-aortic splanchnopleural (P-Sp).
Figure 3
Figure 3. Two distinct types of Sox17GFPCre-expressing cells at E9.5
A) Immunolabeling revealed that GFP expression at E9.5 in the ventral pancreatic bud (VP) was co-localized with Pdx1 (arrows). Several GFPCre-expressing cells were found in the liver bud region (Li) but did not co-localize with Hnf4α (arrowheads). B) GFP was detected in the dorsal aorta (DA); however, it did not co-localize with Sox2, an early ectoderm marker, or Foxa2, a floor plate marker, (arrow). C) GFP was detected in the neural tube (NT); however, it did not co-localize either Sox2 or Sox10, a neural crest cell marker (arrow). D) GFP in the ventral pancreatic bud co-localized with EpCAM (arrow) but not with PECAM (arrowheads). E) GFP in the neural tube co-localized with PECAM (arrow). White boxed areas depict regions enlarged. Scale bar = 50 µm. Floor plate (FP), neural crest cells (NC).
Figure 4
Figure 4. Fate tracing of Sox17-expressing cells at E9.5
A) In E9.5 R26ReYFP;Sox17GFPCre mouse embryos, YFP was detected in the ventral pancreatic bud (VP) and gut tube and displayed co-localization with EpCAM. YFP also co-localized with Sox17GFPCre-expressing cells in the ventral pancreatic bud (arrow). B) YFP was detected in the dorsal aorta (DA) and co-localized with PECAM. Some YFP-positive cells also co-localized with Sox17 (arrow). C) YFP co-localized with PECAM in the endocardium of heart (H) (arrow); however, it did not co-localize with VCAM in the myocardium (arrowheads). White boxed areas depict regions enlarged. Scale bar = 50 µm.
Figure 5
Figure 5. Sox17-expressing endothelial cells exhibit hemogenic potential
A) In E9.5 Sox17GFPCre/+ embryos, GFP was detected in the para-aortic splanchnopleural (P-Sp) area. GFP co-localized with c-Kit-positive cells in the aortic floor (arrows); however, GFP was diminished or not detected in CD41-positive and/or c-Kit positive hematopoietic cells (arrowheads). White boxed areas depict regions enlarged. Scale bar = 50 µm. B) In E9.5 R26ReYFP;Sox17GFPCre embryos, YFP was detected in the para-aortic splanchnopleural (P-Sp) area. YFP co-localized with c-Kit- and CD41-positive cells (arrowheads). C) Both erythrocytes and myeloid (Ter119+ or Mac1+) cells were differentiated from wild type and Sox17-expressing ECs obtained from E9.5 YS and P-Sp. D) YFP expression in hematopoietic cells from E9.5 embryos, E12.5 fetal liver (FL), and adult mouse BM of R26ReYFP;Sox17GFPCre mice (n≥3). YFP-expression was analyzed with hematopoietic cell marker-gated cells.
Figure 6
Figure 6. Comparison of differentially expressed genes in two populations
A) Fluorescence-activated cell sorting (FACS) was used to isolate GFP/EpCAM co-positive cells representing ventral pancreatic epithelial cells (EpCAM+) and GFP+/EpCAM cells representing hemogenic ECs (EpCAM) from dissected E9.5 Sox17GFPCre/+ embryo midguts. B) The distinct difference between the EpCAM+ and EpCAM cell populations is evident in the heat map which displays the RPKM values for 321 genes from three biological replicates for either EpCAM+ or EpCAM. Black color corresponds to an RPKM value of 0, and the brightest red corresponds to ≥ 100 RPKM value. C) The selected transcripts were clustered according to protein class, and the fold change (natural log scale) indicating gene expression in EpCAM+ cells as compared to EpCAM cells is shown. ** > 0.9 and * > 0.85 confidence value.
Figure 7
Figure 7. Isolation of Sox17-expressing cells and identification of alternative variants of Sox17 transcript in EpCAM+ and EpCAM cells
A) Schematic of two transcript variants of Sox17 (T1 & T2). Dark gray box shows coding regions. Black lines (a – d) indicate the amplified regions for PCR. B) Both EpCAM+ and EpCAM cells samples amplified sequence within the coding regions (a and b); however, only the EpCAM sample amplified regions spanning the first three exons. The band in the EpCAM+ lane in d is non-specific (expected band size = 316 bp) (c and d).

References

    1. Foster JW, Dominguez-Steglich MA, Guioli S, et al. Campomelic dysplasia and autosomal sex reversal caused by mutations in an SRY-related gene. Nature. 1994;372:525–530. - PubMed
    1. Kamachi Y, Uchikawa M, Collignon J, et al. Involvement of Sox1, 2 and 3 in the early and subsequent molecular events of lens induction. Development. 1998;125:2521–2532. - PubMed
    1. Schilham MW, Oosterwegel MA, Moerer P, et al. Defects in cardiac outflow tract formation and pro-B-lymphocyte expansion in mice lacking Sox-4. Nature. 1996;380:711–714. - PubMed
    1. Pingault V, Bondurand N, Kuhlbrodt K, et al. SOX10 mutations in patients with Waardenburg-Hirschsprung disease. Nat Genet. 1998;18:171–173. - PubMed
    1. Kanai-Azuma M, Kanai Y, Gad JM, et al. Depletion of definitive gut endoderm in Sox17-null mutant mice. Development. 2002;129:2367–2379. - PubMed

Publication types

MeSH terms