. 2012 Oct;192(2):715-28.
doi: 10.1534/genetics.112.141473. Epub 2012 Aug 3.

Maximizing the reliability of genomic selection by optimizing the calibration set of reference individuals: comparison of methods in two diverse groups of maize inbreds (Zea mays L.)

Affiliations

Maximizing the reliability of genomic selection by optimizing the calibration set of reference individuals: comparison of methods in two diverse groups of maize inbreds (Zea mays L.)

R Rincent et al. Genetics. 2012 Oct.

Abstract

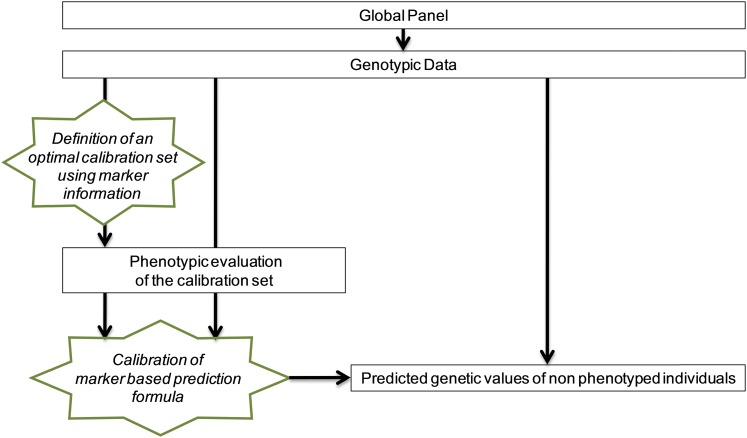
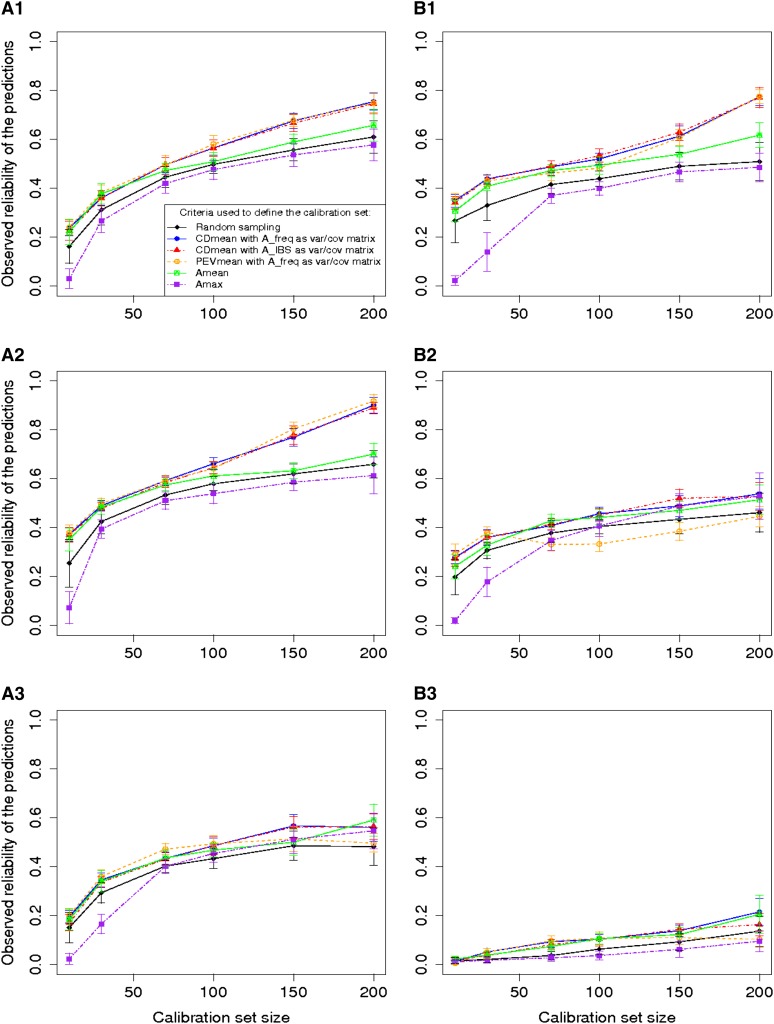
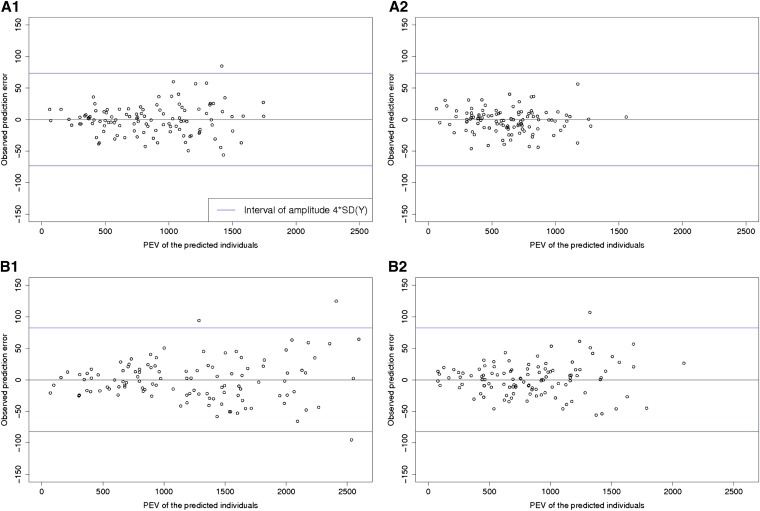
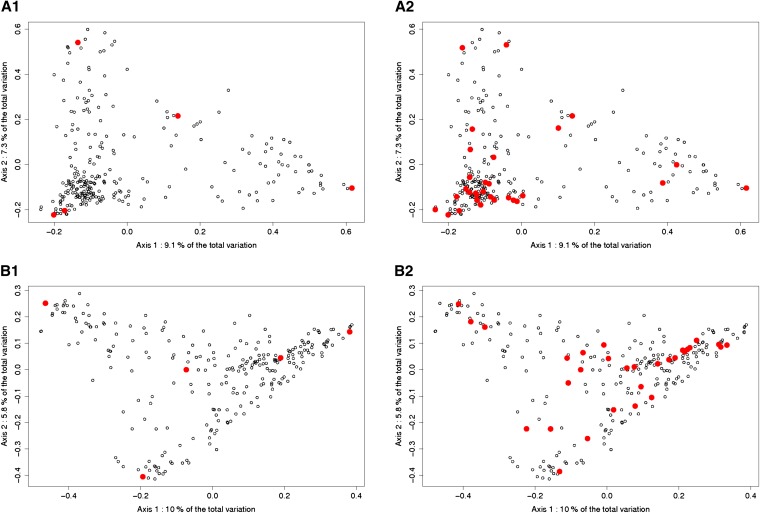
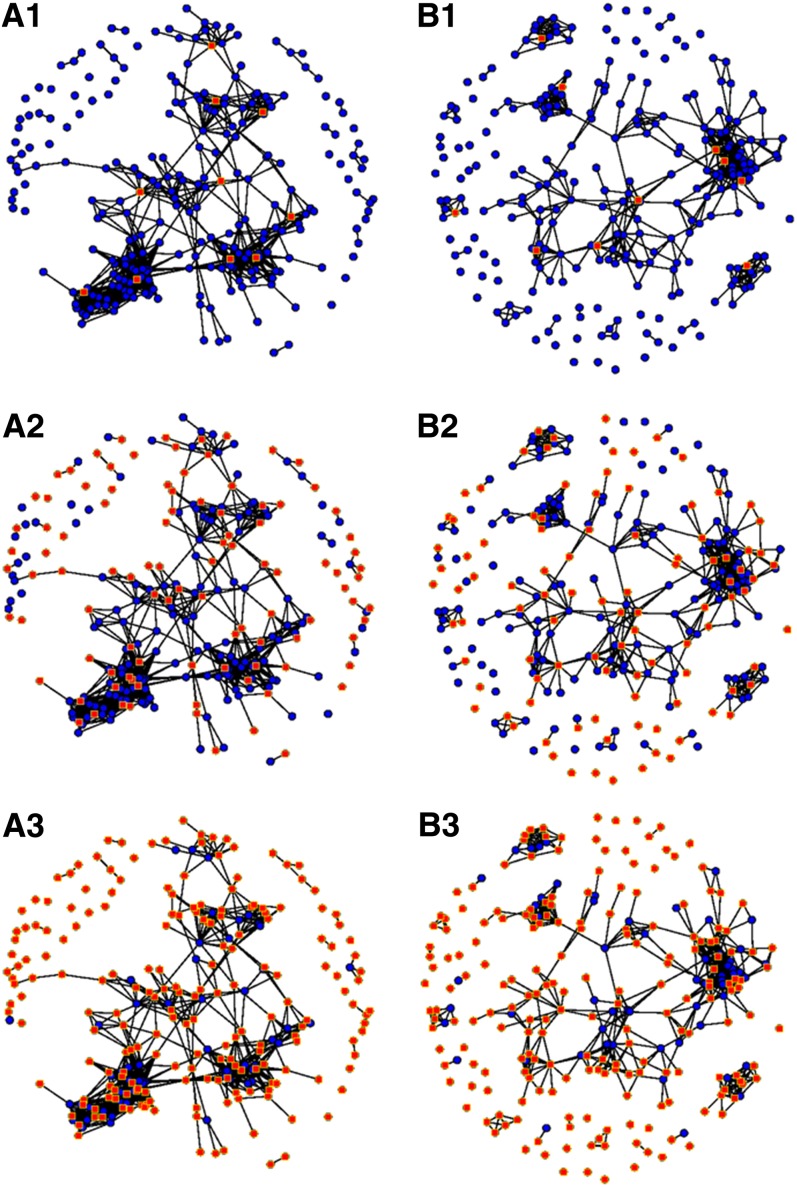
Genomic selection refers to the use of genotypic information for predicting breeding values of selection candidates. A prediction formula is calibrated with the genotypes and phenotypes of reference individuals constituting the calibration set. The size and the composition of this set are essential parameters affecting the prediction reliabilities. The objective of this study was to maximize reliabilities by optimizing the calibration set. Different criteria based on the diversity or on the prediction error variance (PEV) derived from the realized additive relationship matrix-best linear unbiased predictions model (RA-BLUP) were used to select the reference individuals. For the latter, we considered the mean of the PEV of the contrasts between each selection candidate and the mean of the population (PEVmean) and the mean of the expected reliabilities of the same contrasts (CDmean). These criteria were tested with phenotypic data collected on two diversity panels of maize (Zea mays L.) genotyped with a 50k SNPs array. In the two panels, samples chosen based on CDmean gave higher reliabilities than random samples for various calibration set sizes. CDmean also appeared superior to PEVmean, which can be explained by the fact that it takes into account the reduction of variance due to the relatedness between individuals. Selected samples were close to optimality for a wide range of trait heritabilities, which suggests that the strategy presented here can efficiently sample subsets in panels of inbred lines. A script to optimize reference samples based on CDmean is available on request.


Figures

Figure 1
Figure 1
Optimization of calibration set to implement genomic selection in a diversity panel. This procedure was tested on two independent maize diversity panels.
Figure 2
Figure 2
Histograms of the relationship coefficients between pairs of individuals. (A) Dent and (B) Flint. The relationship coefficients were extracted from A_freq. The two panels are considered as the reference populations; as a consequence the mean of the relationship coefficients is equal to zero in each panel.
Figure 3
Figure 3
Reliability of the predictions of Tass_GDD6 (A1 and B1), DMC (A2 and B2) and DM_Yield (A3 and B3) using different sampling algorithms on the Dent panel (A1, A2, and A3), and the Flint panel (B1, B2 and B3). The calibration sets were randomly sampled or defined by maximizing CDmean with a relationship matrix based on the IBS or weighted by the allelic frequencies; minimizing PEVmean with a relationship matrix weighted by the allelic frequencies; minimizing the mean (Amean) or the maximum (Amax) of the relationship coefficient between the reference individuals. The individuals that are not in the calibration set are in the validation set. As a consequence, for each calibration set size the reliability is calculated with a different number of individuals. For each point, the vertical line indicates an interval of 2σRR being the standard deviation of observed reliabilities over the 50 runs). Optimization of PEVmean and CDmean was made with h2 corresponding to the heritability measured for each trait in each panel.
Figure 4
Figure 4
PEV and observed prediction errors for Tass_GDD6 (calibration set size, 150 individuals). (A1 and A2) Dent panel (261 hybrids), calibration set randomly sampled (A1) or optimized with CDmean (A2). (B1 and B2) Flint panel (261 hybrids), calibration set randomly sampled (B1) or optimized with CDmean (B2). The blue lines indicate an interval of 4SD(Y) [SD(Y) being the standard deviation of the adjusted means]. The PEVs were calculated with a λ value corresponding to the estimated heritability of each panel.
Figure 5
Figure 5
Principal coordinates analysis on the Dent and the Flint panel. Axis1 and Axis2 are the two first components of a PCoA on the distance matrix of the corresponding panel. The individuals selected by the algorithm based on CDmean are represented by red dots, other by circles. A1 and A2: PCoA on the Dent panel, calibration set composed of 5 individuals (A1) and 30 individuals (A2). B1 and B2: PCoA on the Flint panel, calibration set composed of 5 individuals (B1) and 30 individuals (B2).
Figure 6
Figure 6
Network representation of the genomic relationship coefficients. (A1, A2, and A3) Dent panel, 3 calibration set sizes: 10 (A1), 100 (A2), and 200 (A3). (B1, B2 and B3) Flint panel, 3 calibration set sizes: 10 (B1), 100 (B2), and 200 (B3). These networks are drawn with a Fruchterman and Reingold’s force-directed placement algorithm. Each node represents an individual; the pairs of individuals with a relationship coefficient >0.2 are linked by an edge. The individuals selected by the CDmean algorithm are represented by red squares and others by blue points.

References

    1. Albrecht T., Wimmer V., Auinger H.-J., Erbe M., Knaak C., et al. , 2011. Genome-based prediction of testcross values in maize. Theor. Appl. Genet. 123: 339–350 - PubMed
    1. Amin N., van Duijn C. M., Aulchenko Y. S., 2007. A genomic background based method for association analysis in related individuals. PLoS ONE 2: e1274. - PMC - PubMed
    1. Astle W., Balding D. J., 2009. Population structure and cryptic relatedness in genetic association studies. Stat. Sci. 24: 451–471
    1. Atkinson A. C., Donev A. N., Tobias R. D., 2007. Optimum Experimental Designs, With SAS. Clarendon Press, Oxford
    1. Bernardo R., Yu J., 2007. Prospects for genomewide selection for quantitative traits in maize. Crop Sci. 47: 1082

Publication types