

Independent FLC mutations as causes of flowering-time variation in Arabidopsis thaliana and Capsella rubella
- PMID: 22865739
- PMCID: PMC3454893
- DOI: 10.1534/genetics.112.143958
Independent FLC mutations as causes of flowering-time variation in Arabidopsis thaliana and Capsella rubella
Abstract
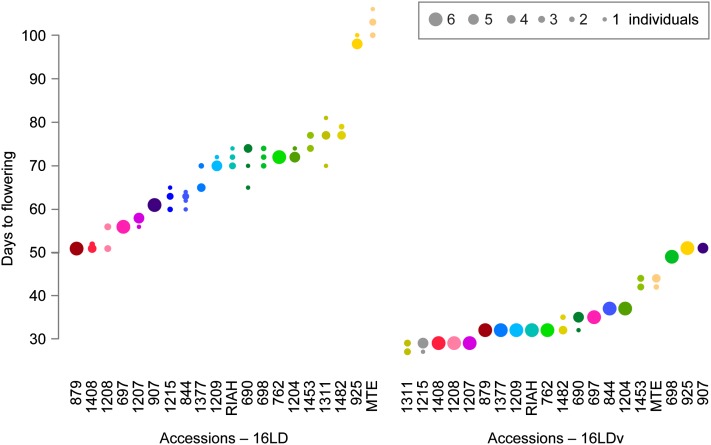
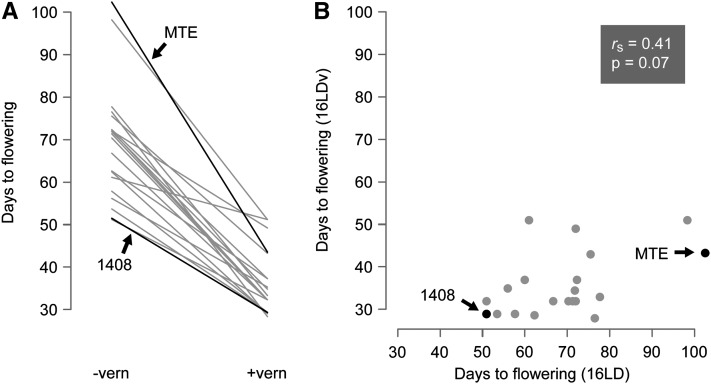
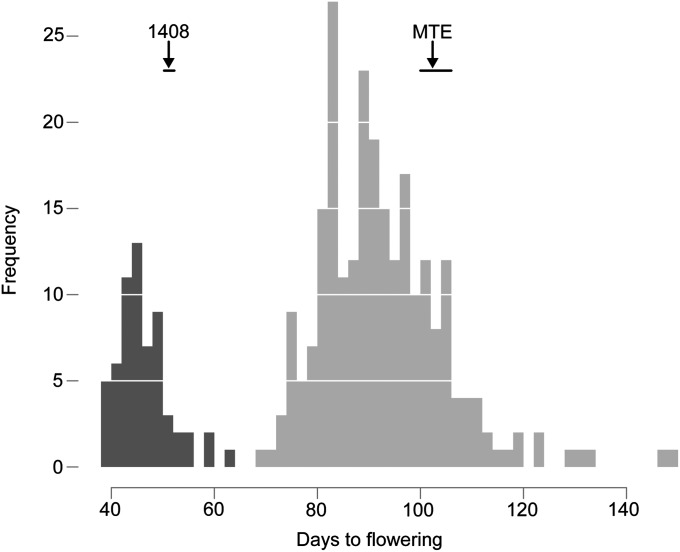
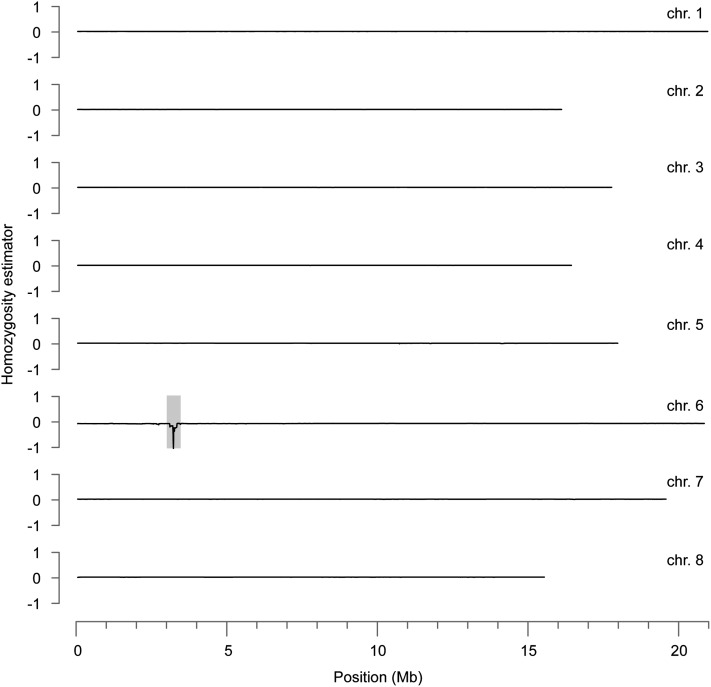
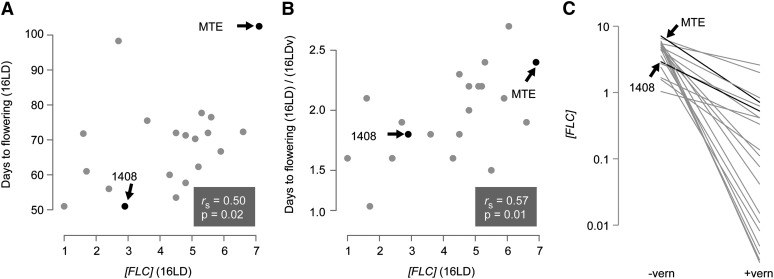
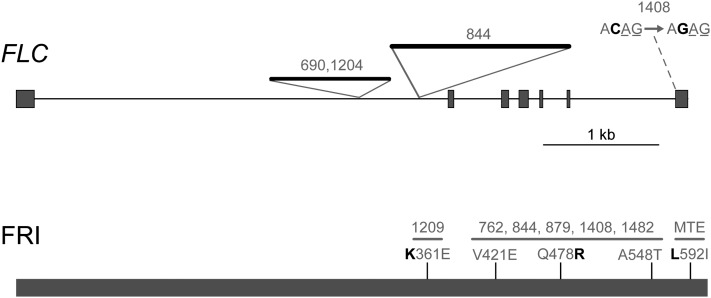
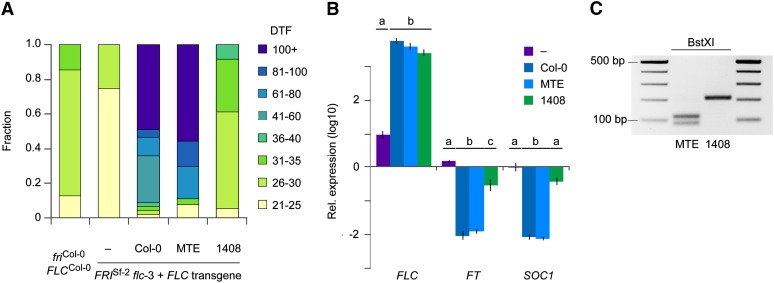
Capsella rubella is an inbreeding annual forb closely related to Arabidopsis thaliana, a model species widely used for studying natural variation in adaptive traits such as flowering time. Although mutations in dozens of genes can affect flowering of A. thaliana in the laboratory, only a handful of such genes vary in natural populations. Chief among these are FRIGIDA (FRI) and FLOWERING LOCUS C (FLC). Common and rare FRI mutations along with rare FLC mutations explain a large fraction of flowering-time variation in A. thaliana. Here we document flowering time under different conditions in 20 C. rubella accessions from across the species' range. Similar to A. thaliana, vernalization, long photoperiods and elevated ambient temperature generally promote flowering. In this collection of C. rubella accessions, we did not find any obvious loss-of-function FRI alleles. Using mapping-by-sequencing with two strains that have contrasting flowering behaviors, we identified a splice-site mutation in FLC as the likely cause of early flowering in accession 1408. However, other similarly early C. rubella accessions did not share this mutation. We conclude that the genetic basis of flowering-time variation in C. rubella is complex, despite this very young species having undergone an extreme genetic bottleneck when it split from C. grandiflora a few tens of thousands of years ago.
Figures
Similar articles
-
FRIGIDA-independent variation in flowering time of natural Arabidopsis thaliana accessions.Genetics. 2005 Jul;170(3):1197-207. doi: 10.1534/genetics.104.036533. Epub 2005 May 23. Genetics. 2005. PMID: 15911588 Free PMC article.
-
Role of FRIGIDA and FLOWERING LOCUS C in determining variation in flowering time of Arabidopsis.Plant Physiol. 2005 Jun;138(2):1163-73. doi: 10.1104/pp.105.061309. Epub 2005 May 20. Plant Physiol. 2005. PMID: 15908596 Free PMC article.
-
Altitudinal and climatic adaptation is mediated by flowering traits and FRI, FLC, and PHYC genes in Arabidopsis.Plant Physiol. 2011 Dec;157(4):1942-55. doi: 10.1104/pp.111.183426. Epub 2011 Oct 11. Plant Physiol. 2011. PMID: 21988878 Free PMC article.
-
Fine-tuning timing: natural variation informs the mechanistic basis of the switch to flowering in Arabidopsis thaliana.J Exp Bot. 2017 Nov 28;68(20):5439-5452. doi: 10.1093/jxb/erx270. J Exp Bot. 2017. PMID: 28992087 Review.
-
Diversification of fruit shape in the Brassicaceae family.Plant Reprod. 2016 Jun;29(1-2):149-63. doi: 10.1007/s00497-016-0278-6. Epub 2016 Mar 25. Plant Reprod. 2016. PMID: 27016361 Review.
Cited by
-
Beyond the thale: comparative genomics and genetics of Arabidopsis relatives.Nat Rev Genet. 2015 May;16(5):285-98. doi: 10.1038/nrg3883. Epub 2015 Apr 9. Nat Rev Genet. 2015. PMID: 25854181 Review.
-
Parallel reduction in flowering time from de novo mutations enable evolutionary rescue in colonizing lineages.Nat Commun. 2022 Mar 18;13(1):1461. doi: 10.1038/s41467-022-28800-z. Nat Commun. 2022. PMID: 35304466 Free PMC article.
-
Is Genetic Evolution Predictable?Plant Cell. 2018 Jun;30(6):1171-1172. doi: 10.1105/tpc.18.00438. Epub 2018 Jun 12. Plant Cell. 2018. PMID: 29895569 Free PMC article. No abstract available.
-
Habitat-Associated Life History and Stress-Tolerance Variation in Arabidopsis arenosa.Plant Physiol. 2016 May;171(1):437-51. doi: 10.1104/pp.15.01875. Epub 2016 Mar 3. Plant Physiol. 2016. PMID: 26941193 Free PMC article.
-
Spatiotemporal seed development analysis provides insight into primary dormancy induction and evolution of the Lepidium delay of germination1 genes.Plant Physiol. 2013 Apr;161(4):1903-17. doi: 10.1104/pp.112.213298. Epub 2013 Feb 20. Plant Physiol. 2013. PMID: 23426197 Free PMC article.
References
-
- Arendt J., Reznick D., 2008. Convergence and parallelism reconsidered: What have we learned about the genetics of adaptation? Trends Ecol. Evol. 23: 26–32 - PubMed
-
- Axelsson T., Shavorskaya O., Lagercrantz U., 2001. Multiple flowering time QTLs within several Brassica species could be the result of duplicated copies of one ancestral gene. Genome 44: 856–864 - PubMed
-
- Barrett R. D., Schluter D., 2008. Adaptation from standing genetic variation. Trends Ecol. Evol. 23: 38–44 - PubMed
-
- Bergelson J., Roux F., 2010. Towards identifying genes underlying ecologically relevant traits in Arabidopsis thaliana. Nat. Rev. Genet. 11: 867–879 - PubMed
Publication types
MeSH terms
Substances
LinkOut - more resources
Full Text Sources
Other Literature Sources
Molecular Biology Databases
