. 2011 Aug 6;1(4):576-601.
doi: 10.1098/rsfs.2011.0037. Epub 2011 Jun 8.

Micro-ultrasound for preclinical imaging

Affiliations

Micro-ultrasound for preclinical imaging

F Stuart Foster et al. Interface Focus. .

Abstract

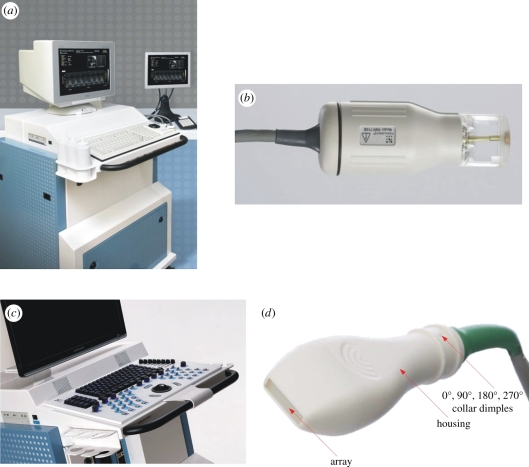
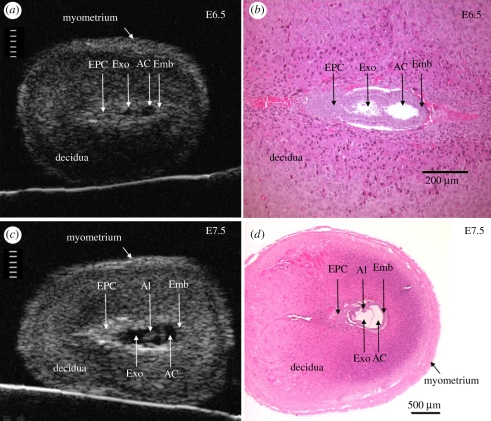
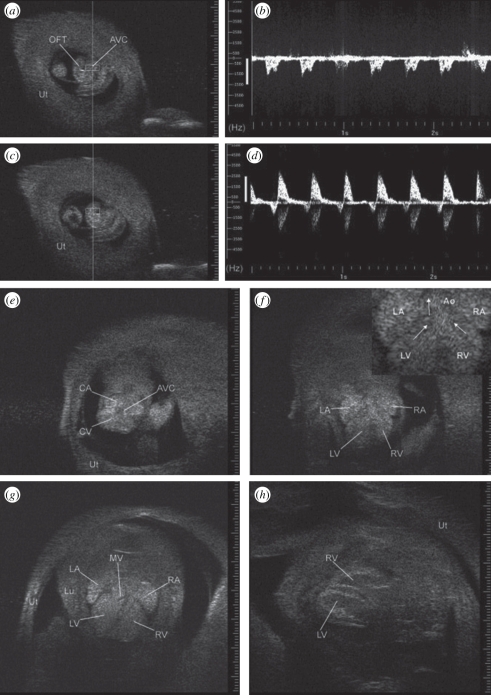
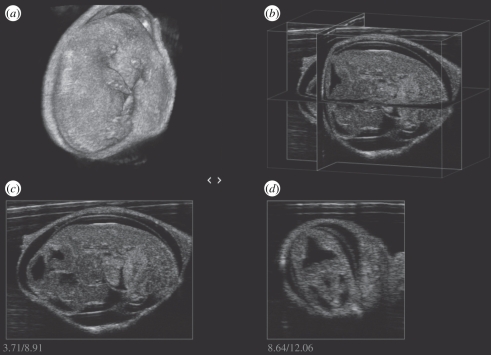
Over the past decade, non-invasive preclinical imaging has emerged as an important tool to facilitate biomedical discovery. Not only have the markets for these tools accelerated, but the numbers of peer-reviewed papers in which imaging end points and biomarkers have been used have grown dramatically. High frequency 'micro-ultrasound' has steadily evolved in the post-genomic era as a rapid, comparatively inexpensive imaging tool for studying normal development and models of human disease in small animals. One of the fundamental barriers to this development was the technological hurdle associated with high-frequency array transducers. Recently, new approaches have enabled the upper limits of linear and phased arrays to be pushed from about 20 to over 50 MHz enabling a broad range of new applications. The innovations leading to the new transducer technology and scanner architecture are reviewed. Applications of preclinical micro-ultrasound are explored for developmental biology, cancer, and cardiovascular disease. With respect to the future, the latest developments in high-frequency ultrasound imaging are described.

Keywords: angiogenesis; cancer models; cardiovascular disease; micro-ultrasound; mouse imaging; phenotyping.


Figures

Figure 1.
Figure 1.
High-frequency micro-ultrasound imaging systems developed over the past 10 years have enabled efficient, high resolution, quantitative analysis of animal models of disease. Earlier systems (a) relied on mechanically steered single element scanheads (b). More recently, fully beam-formed scanners (c) have been developed using novel high-frequency arrays (d). The latter devices use no mechanical actuation and improve the depth of field of the imaging system.
Figure 2.
Figure 2.
(a) The imaging system of figure 1c being used to image a mouse. The mouse is anaesthetized and lying on a heated stage and is monitored for heart rate, breathing, and in some cases blood pressure. Scanning is performed after removal of hair (if necessary) and after the application of a heated gel to the region of interest. The ultrasound scanhead is mounted on a ‘Rail System’ inside a biosafety cabinet to reduce jitter in the image due to hand motion. (b) Example of a still frame from a real-time sequence of images of the abdominal region of the mouse. This ‘B-scan’ image shows, from left to right, a section through the kidney, adrenal gland, the vena cava, portal vein, and the aorta.
Figure 3.
Figure 3.
Anatomical detail visible in ultrasound images of the conceptus in the exteriorized uterus at E6.5 and E7.5. Ultrasound images (a,c) and H and E histological sections (b,d) of implantation sites at E6.5 (a,b) and E7.5 (c,d). Divisions in the scales in (a) and (c) are 100 µm apart. The conceptus in histological sections is smaller than in vivo due to shrinkage during tissue preparation (fixation and dehydration). AC, amniotic cavity; Al, allantois; Emb, embryo; EPC, ectoplacental cone region; Exo, exocoelomic cavity. Adapted from [48].
Figure 4.
Figure 4.
Images of the embryonic heart as it develops from a U-shaped tube at E9.5 to a four-chambered structure at E16.5 when viewed through the exteriorized uterus (Ut) using 55 MHz. (a) U-shaped embryonic heart at E9.5. Doppler sample volume (rectangle) within atrioventricular canal (AVC) generated ventricular inflow Doppler waveform in (b). (c) Doppler sample volume in the outflow tract (OFT) generated the Doppler waveform in (d). (e) Transverse view at E10.5 showing common atrium (CA), common ventricle (CV), and common atrioventricular canal (AVC). (f) Transverse view at E12.5 showing left and right atrium (LA, RA) and left and right ventricle (LV, RV) with enlargement in inset with arrows highlighting streamlines towards the aorta (Ao). (g) Transverse view at E13.5 with mitral valve leaflets (MV) and complete septum visible (Lu, lung). (h) Long-axis view of ventricles at E16.5. Echogenicity of embryonic blood tends to reduce blood–tissue contrast but this effect attenuates near term. Adapted from [22].
Figure 5.
Figure 5.
(a) Mouse embryo at E13.5 imaged in three dimensions in an exteriorized uterus using an MS550 linear array (VisualSonics, Toronto). Intersecting planes can be displayed in arbitrary directions (b) or as separate planes (c,d).
Figure 6.
Figure 6.
Representative images of ocular development in the mouse. Visible structures include the optic placode and vesicle (arrow) at E11.5, evidence of retinal development at E13.5, corneal development at E14.5 and progressive morphogenesis of the eye between E15.5 and E18.5. Adapted from [46].
Figure 7.
Figure 7.
Micro-ultrasound imaging of the placental circulation in the mouse. (a) Contrast enhanced visualization of the uteroplacental blood supply to the mouse placenta using MBs infused into the maternal circulation at E14.5. A spiral artery in the decidua is indicated by the arrowhead. Arrows show the maternal arterial canals. Canals are formed by foetal trophoblast cells and they direct maternal blood from the spiral arteries into the labyrinth, the exchange region of the placenta. (b) Colour Doppler imaging of the uteroplacental and foetoplacental blood supply to the mouse placenta at E14.5. A spiral artery is shown by the arrowhead. The spiral movement of blood in the maternal spiral artery causes the red–blue alternating pattern as the blood alternates between flowing towards and away from the transducer. Flow in the foetal chorionic plate vessels (arrow) and in the foetoplacental arterioles (asterisk) directs foetal blood deep into the labyrinth exchange region of the placenta.
Figure 8.
Figure 8.
Colour Doppler image showing the pulmonary trunk and ductus arteriosus of a mouse neonate within hours of birth before closure of the ductus arteriosus. (a) Blood flow in the pulmonary trunk is away from the transducer (blue) and flow in the ductus arteriosus is towards the transducer (red). The angled yellow line shows the angle of insonation and the gap in the yellow line within the ductus arteriosus shows the position of the Doppler sample volume. (b) The ductus arteriosus is still open so the Doppler blood velocity waveform shows prominent flow towards the pulmonary trunk through the ductus arteriosus (positive velocity) in systole and brief flow reversals towards the aorta (negative velocity) in diastole.
Figure 9.
Figure 9.
Ultrasound-guided microinjection of green fluorescent microspheres into the exocoelomic cavity of a mouse conceptus at E7.5. (a) The glass microinjection catheter (highlighted with a dashed line) is shown with its tip in the exocoelomic cavity in an exteriorized conceptus. (b) Histological image showing the anatomy of the conceptus at E7.5. (c) A conceptus dissected on the day of injection showing green fluorescent microspheres in the exocoelomic cavity. The embryo will form above and the placenta below this cavity. (d) A placenta dissected later in gestation at E11.5 showing green fluorescent microspheres confined within the labyrinth region of the placenta. Adapted from [48].
Figure 10.
Figure 10.
Ultrasound guided microinjection into the spinal canal of a mouse embryo. Progressive penetration to the target tissue is shown (ac). The elastic nature of most tissues makes guidance challenging as shown in (b) where deformation significantly modifies the projected trajectory.
Figure 11.
Figure 11.
Wash-in of MB contrast at t = 0 s (a), 1 s (b), and 5 s (c) following a tail vein injection of 80 µl MicroMarker contrast. Lewis lung carcinoma Swiss nude mouse. Probe: MS250. Scale bar, 2 mm.
Figure 12.
Figure 12.
(a) Identification of ROIs in the Lewis lung carcinoma of figure 11. (b) Parametric map of relative blood volume (based on the peak of the wash-in curve) overlaid on the contrast image. (c) Wash-in kinetics of the three ROIs in (a).
Figure 13.
Figure 13.
Orthotopic breast tumour growth and relative blood volume measured using MB contrast infusions following a one week treatment regimen with Sutent (sunitinib) at 80 mg kg−1 d−1. (a) Tumour growth, (b) blood volume. Black bar, control; grey bar, treated.
Figure 14.
Figure 14.
(a) Schematic of a molecular imaging experiment. At time t = 0 a bolus of contrast is injected in the tail vein of the mouse. As the signal due to bound contrast increases the unbound agent is cleared by the lungs, liver and spleen. At 4 min a disruption pulse eliminates the contrast in the imaging plane after which only circulating MBs are detected. The difference between pre- and post-disruption is a representation of the ‘molecular signal’. (b) Actual signal for a breast cancer orthograft (MDA-MB-231) following a 50 µl injection of VEGFR-2 targeted MBs (1.02 × 109 MB ml−1).
Figure 15.
Figure 15.
Molecular imaging of four different mice bearing melanoma (MeWo) xenografts. Bound MBs targeted to VEGFR-2 are displayed on a green colour scale and overlaid on B-mode images.
Figure 16.
Figure 16.
Micro-ultrasound imaging of the right and left atrial inflow channels, with anatomical confirmation by magnetic resonance (MR) imaging. (a) Image of a right parasternal longitudinal section. (b) The Doppler flow spectrum of right superior vena cava (RSVC), showing a small retrograde wave caused by atrial contraction. (c) MR image of a similar section to the micro-ultrasound image in (a), showing the vascular continuity from RSVC to the right atrium (RA), and the surrounding organs such as thymus (TH), right subclavian artery (RSCA), right pulmonary artery (RPA) and right pulmonary vein (RPV). (d) The micro-ultrasound image of a left parasternal longitudinal section showing the RPV, LA and LV, with the Doppler sample volume in the entrance of the RPV. (e) The Doppler flow spectrum from PV. The arrows indicate heart beats at the end of inspiration. (f) The MR image of a similar section to the micro-ultrasound image in (d). Adapted from [22].
Figure 17.
Figure 17.
Displacement maps for a day 1 post-MI mouse heart superimposed onto the original ultrasound images to provide a visual representation of the relationship between anatomy and function. (a) Mid-ventricular, short-axis view. (b) Long-axis view of a second day 1 post-MI mouse heart. Wall motion defects, involving reduced regional displacement, are indicated with large arrows. Adapted from [112].
Figure 18.
Figure 18.
End diastole (ED) to end systole (ES) Err (radial) strain maps from a day 1 post-MI mouse heart using MRI (a) and ultrasound (b). ED-to-ES Ecc (circumferential) strain maps from the same mouse heart using MRI (c) and ultrasound (d). In both the Err and Ecc, maps, defects in contraction are observed in the anterolateral LV (as indicated by arrows). Adapted from [112].
Figure 19.
Figure 19.
Sequence of electromechanical displacement images every 0.625 ms in a normal mouse left ventricle during sinus rhythm. The displacements are colour-coded and overlaid onto the B-mode images. Positive displacements (in red) represent upward motion, which negative displacements (in blue) represent downward motion. The arrows indicate the propagation of the electromechanical activation from the apex to the base along the posteriolateral wall.
Figure 20.
Figure 20.
Flow distribution in the aortic arch in a ldlr−/− mouse with surgically induced aortic regurgitation. (a) The Doppler colour flow frame at the peak systole showing the antegrade flow in blue with the higher velocity along the greater curvature and the lower velocity along the lesser curvature. (b) The frame at the early diastole showing the retrograde flow (red) along the lesser curvature, when the flow along the greater curvature is still moving forward (blue). (c) The frame at the middle diastole showing the retrograde flow (red) in the whole aortic arch. The Doppler flow spectra recorded along the lesser curvature, at the middle lumen and along the greater curvature in the aortic arch show the altered haemodynamics associated with the regurgitation. Adapted from [141].

References

    1. Frost & Sullivan 2010. US preclinical animal imaging systems market. N5BB-50, 1–103
    1. Sherar M. D., Noss M. B., Foster F. S. 1987. Ultrasound backscatter microscopy images the internal structure of living tumour spheroids. Nature 330, 493–49510.1038/330493a0 (doi:10.1038/330493a0) - DOI - DOI - PubMed
    1. Pavlin C. J., Harasiewicz K., Sherar M. D., Foster F. S. 1991. Clinical use of ultrasound biomicroscopy. Ophthalmology 98, 287–295 - PubMed
    1. Pavlin C. J., Sherar M. D., Foster F. S. 1990. Subsurface imaging of the eye by ultrasound biomicroscopy. Ophthalmology 97, 244–250 - PubMed
    1. Sherar M. D., Starkoski B. G., Taylor W. B., Foster F. S. 1989. A 100 MHz B-scan ultrasound backscatter microscope. Ultrason. Imag. 11, 95–10510.1016/0161-7346(89)90002-3 (doi:10.1016/0161-7346(89)90002-3) - DOI - DOI - PubMed

LinkOut - more resources