

Quantitative and qualitative assessment of structural magnetic resonance imaging data in a two-center study
- PMID: 22867031
- PMCID: PMC3447701
- DOI: 10.1186/1471-2342-12-27
Quantitative and qualitative assessment of structural magnetic resonance imaging data in a two-center study
Abstract
Background: Multi-center magnetic resonance imaging (MRI) studies present an opportunity to advance research by pooling data. However, brain measurements derived from MR-images are susceptible to differences in MR-sequence parameters. It is therefore necessary to determine whether there is an interaction between the sequence parameters and the effect of interest, and to minimise any such interaction by careful choice of acquisition parameters. As an exemplar of the issues involved in multi-center studies, we present data from a study in which we aimed to optimize a set of volumetric MRI-protocols to define a protocol giving data that are consistent and reproducible across two centers and over time.
Methods: Optimization was achieved based on data quality and quantitative measures, in our case using FreeSurfer and Voxel Based Morphometry approaches. Our approach consisted of a series of five comparisons. Firstly, a single-center dataset was collected, using a range of candidate pulse-sequences and parameters chosen on the basis of previous literature. Based on initial results, a number of minor changes were implemented to optimize the pulse-sequences, and a second single-center dataset was collected. FreeSurfer data quality measures were compared between datasets in order to determine the best performing sequence(s), which were taken forward to the next stage of testing. We subsequently acquired short-term and long-term two-center reproducibility data, and quantitative measures were again assessed to determine the protocol with the highest reproducibility across centers. Effects of a scanner software and hardware upgrade on the reproducibility of the protocols at one of the centers were also evaluated.
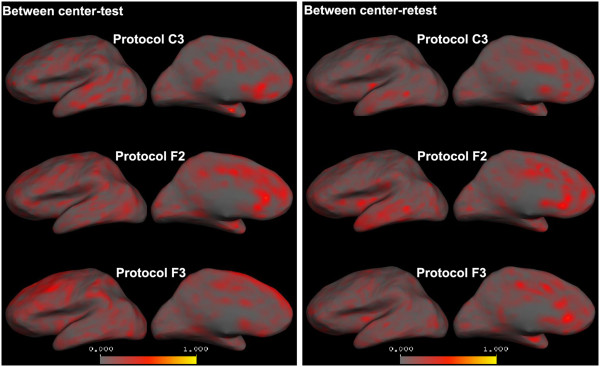
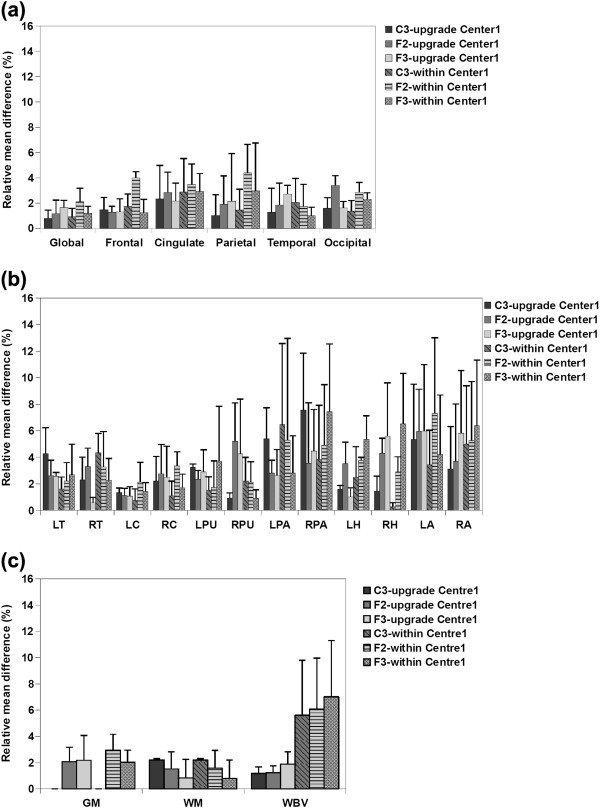
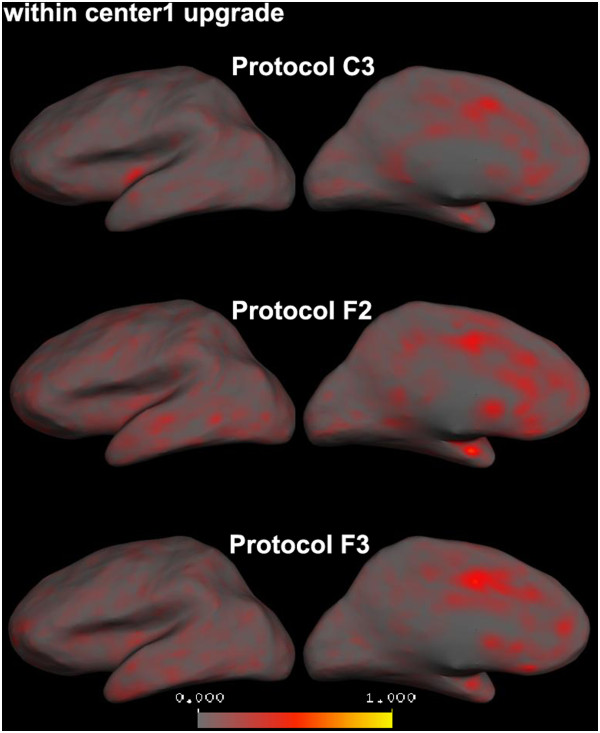
Results: Assessing the quality measures from the first two datasets allowed us to define artefact-free protocols, all with high image quality as assessed by FreeSurfer. Comparing the quantitative test and retest measures, we found high within-center reproducibility for all protocols, but lower between-center reproducibility for some protocols than others. The upgrade showed no important effects.
Conclusions: We were able to determine (for the scanners used in this study) an optimised protocol, which gave the highest within- and between-center reproducibility of those assessed, and give details of this protocol here. More generally, we discuss some of the issues raised by multi-center studies and describe a methodical approach to take towards optimization and standardization, and recommend performing this kind of procedure to other investigators.
Figures
References
-
- Hermann BP, Seidenberg M, Bell B. The neurodevelopmental impact of childhood onset temporal lobe epilepsy on brain structure and function and the risk of progressive cognitive effects. Prog Brain Res. 2002;135:429–438. - PubMed
-
- Bremner JD, Vythilingam M, Vermetten E, Southwick SM, McGlashan T, Nazeer A, Khan S, Vaccarino LV, Soufer R, Garg PK, Ng CK, Staib LH, Duncan JS, Charney DS. MRI and PET study of deficits in hippocampal structure and function in women with childhood sexual abuse and posttraumatic stress disorder. Am J Psychiatry. 2003;160(5):924–932. doi: 10.1176/appi.ajp.160.5.924. - DOI - PubMed
Publication types
MeSH terms
LinkOut - more resources
Full Text Sources
Medical
Research Materials
