

Daytime variations of tear osmolarity and tear meniscus volume
- PMID: 22868900
- PMCID: PMC3430831
- DOI: 10.1097/ICL.0b013e31825fed57
Daytime variations of tear osmolarity and tear meniscus volume
Abstract
Objectives: The aim of this study was to determine the pattern of variations in tear osmolarity and tear meniscus volume in patients with dry eyes and in healthy control subjects over an 8-hr daytime period.
Methods: Ten normal subjects (5 men and 5 women with a mean age of 27±7 years) and 10 dry eye patients (4 men and 6 women with a mean age of 36±12 years) who had been diagnosed on the basis of having an ocular surface discomfort index >12 and a tear breakup time of <10 sec or Schirmer test score of <5 mm were included. The tear meniscus volumes of the participants were measured using ultrahigh resolution optical coherence tomography (OCT), and tear osmolarity was measured using the TearLab Osmolarity System. Both measurements protocols were conducted on the right eye of each participant every 2 hrs beginning at 8:30 AM and ending at 4:30 PM. The OCT imaging was performed first and was followed by osmolarity testing.
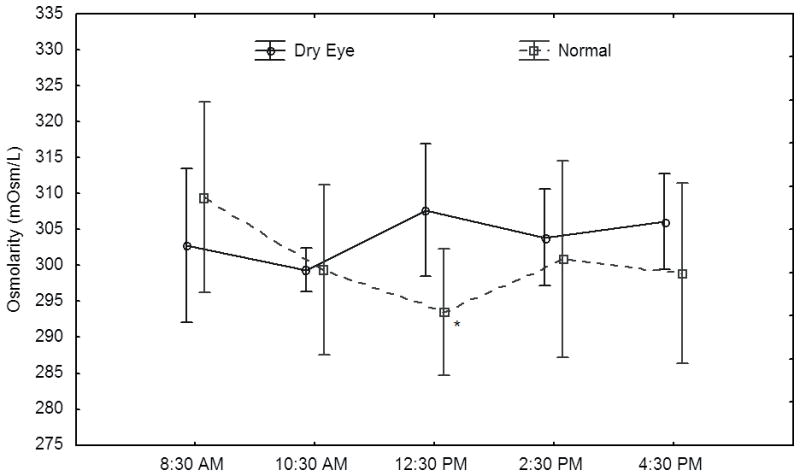
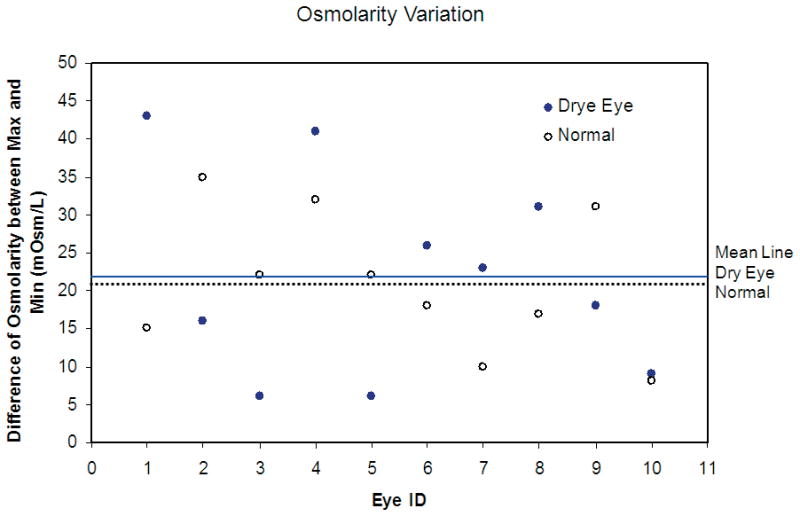
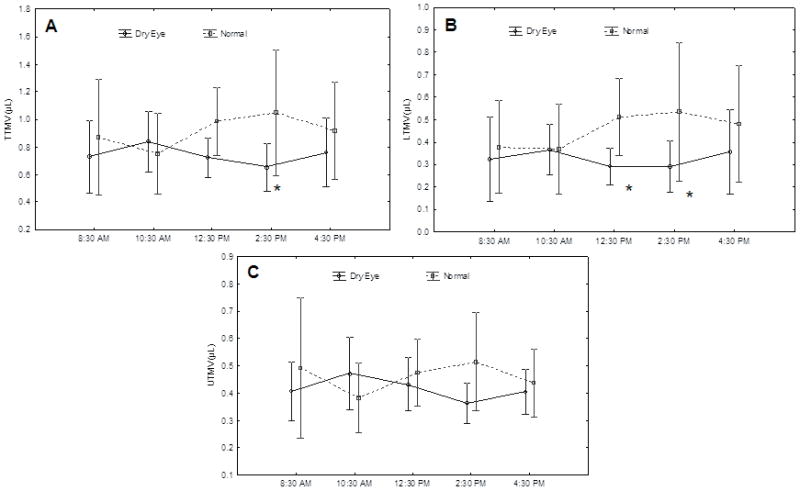
Results: The mean tear osmolarity of the dry eye patients was 304.0±10.8 mOsm/L, and the mean tear osmolarity of the normal subjects was 298.0±14.2 mOsm/L (P>0.05). Over the course of 8 hrs, the average measured osmolarities of the dry eye group varied by approximately 21.9±13.5 mOsm/L (range, 6-43 mOsm/L), and the average measured tear osmolarities of the normal group varied by approximately 21.0±9.2 mOsm/L (range, 8-35 mOsm/L). At 2:30 PM, the average volume of the tear menisci in the dry eye group was significantly lower than that of the subjects in the normal group (P<0.05). No correlations between the tear meniscus volumes and tear osmolarities of either group were observed.
Conclusions: Variations in the tear osmolarities of individual dry eye patients and healthy normal control subjects were documented over the course of 8 daytime hours. No relationships between tear osmolarities and tear meniscus volumes were observed.
Figures

Similar articles
-
Impact of temporal tear meniscus height on the tear osmolarity measurements.Sci Rep. 2025 Jul 28;15(1):27459. doi: 10.1038/s41598-025-93764-1. Sci Rep. 2025. PMID: 40721497 Free PMC article.
-
Correlation of Dry Eye Workshop Dry Eye Severity Grading System With Tear Meniscus Measurement by Optical Coherence Tomography and Tear Osmolarity.Eye Contact Lens. 2016 May;42(3):153-7. doi: 10.1097/ICL.0000000000000168. Eye Contact Lens. 2016. PMID: 26067398
-
[Tear Film Osmolarity in Normal Individuals: Comparison of Two Osmometers].Klin Monbl Augenheilkd. 2020 May;237(5):649-654. doi: 10.1055/a-1155-6468. Epub 2020 May 20. Klin Monbl Augenheilkd. 2020. PMID: 32434250 German.
-
Basal Tear Osmolarity as a metric to estimate body hydration and dry eye severity.Prog Retin Eye Res. 2018 May;64:56-64. doi: 10.1016/j.preteyeres.2018.02.001. Epub 2018 Feb 21. Prog Retin Eye Res. 2018. PMID: 29476817 Review.
-
Diurnal variations of tear film osmolarity on the ocular surface.Clin Exp Optom. 2023 May;106(4):351-361. doi: 10.1080/08164622.2022.2051697. Epub 2022 Apr 11. Clin Exp Optom. 2023. PMID: 35410571 Review.
Cited by
-
An assessment of the ocular tear film in patients with thyroid disorders.Clin Ophthalmol. 2019 Jun 28;13:1019-1026. doi: 10.2147/OPTH.S210044. eCollection 2019. Clin Ophthalmol. 2019. PMID: 31388294 Free PMC article.
-
TFOS DEWS II Tear Film Report.Ocul Surf. 2017 Jul;15(3):366-403. doi: 10.1016/j.jtos.2017.03.006. Epub 2017 Jul 20. Ocul Surf. 2017. PMID: 28736338 Free PMC article. Review.
-
Temporal Progression of Entry Factors into the Vicious Circle of Dry Eye in Untreated Sufferers.Life (Basel). 2024 Jun 26;14(7):806. doi: 10.3390/life14070806. Life (Basel). 2024. PMID: 39063561 Free PMC article.
-
Tear Biomarkers and Alzheimer's Disease.Int J Mol Sci. 2023 Aug 30;24(17):13429. doi: 10.3390/ijms241713429. Int J Mol Sci. 2023. PMID: 37686235 Free PMC article. Review.
-
Impact of temporal tear meniscus height on the tear osmolarity measurements.Sci Rep. 2025 Jul 28;15(1):27459. doi: 10.1038/s41598-025-93764-1. Sci Rep. 2025. PMID: 40721497 Free PMC article.
References
-
- Golding TR, Bruce AS, Mainstone JC. Relationship between tear-meniscus parameters and tear-film breakup. Cornea. 1997;16:649–661. - PubMed
-
- Savini G, Barboni P, Zanini M. Tear meniscus evaluation by optical coherence tomography. Ophthalmic Surg Lasers Imaging. 2006;37:112–118. - PubMed
-
- Tomlinson A, Khanal S, Ramaesh K, et al. Tear film osmolarity: determination of a referent for dry eye diagnosis. Invest Ophthalmol Vis Sci. 2006;47:4309–4315. - PubMed
-
- Doughty MJ, Fonn D, Richter D, et al. A patient questionnaire approach to estimating the prevalence of dry eye symptoms in patients presenting to optometric practices across Canada. Optom Vis Sci. 1997;74:624–631. - PubMed
-
- Tomlinson A, Khanal S. Assessment of tear film dynamics: quantification approach. Ocul Surf. 2005;3:81–95. - PubMed
Publication types
MeSH terms
Grants and funding
LinkOut - more resources
Full Text Sources
Medical
