. 2012 Aug 6;198(3):295-304.
doi: 10.1083/jcb.201204035.

Loss of ATM kinase activity leads to embryonic lethality in mice

Affiliations

Loss of ATM kinase activity leads to embryonic lethality in mice

Jeremy A Daniel et al. J Cell Biol. .

Abstract

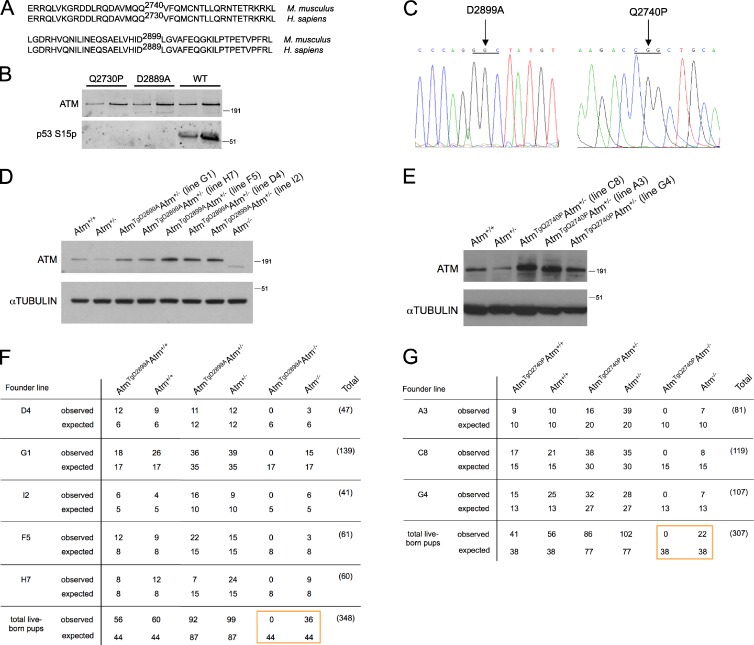
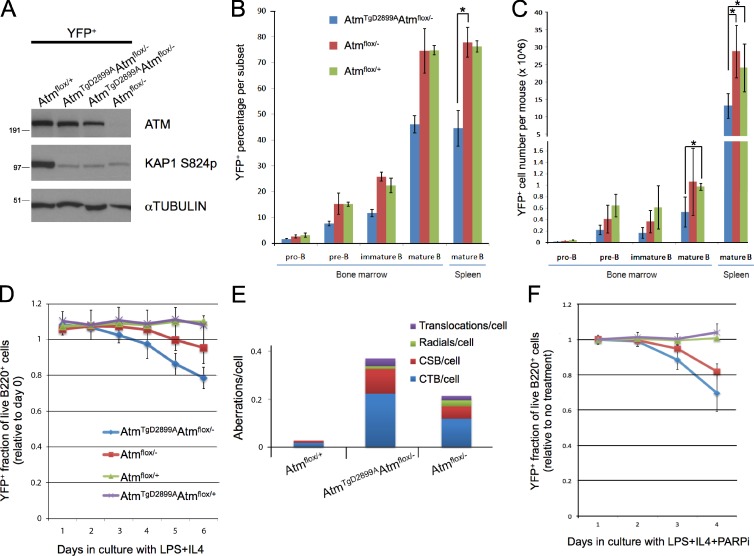
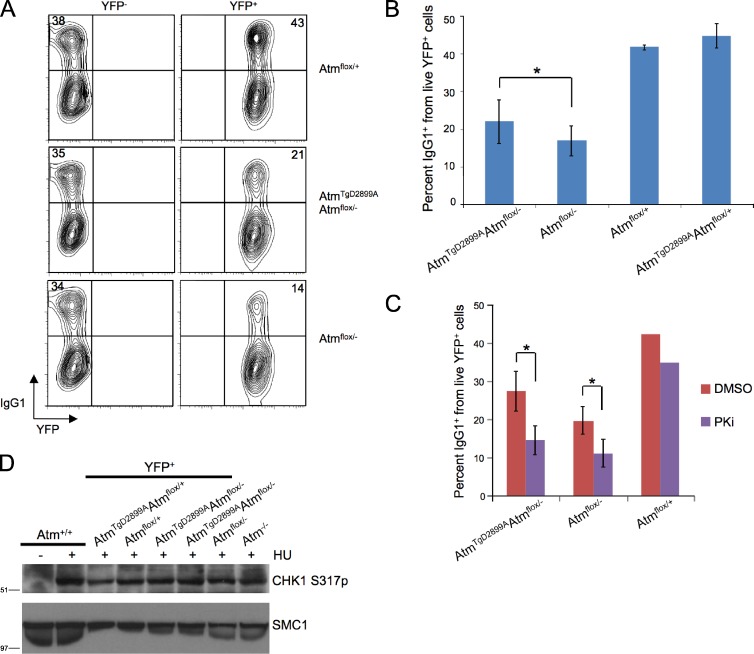
Ataxia telangiectasia (A-T) mutated (ATM) is a key deoxyribonucleic acid (DNA) damage signaling kinase that regulates DNA repair, cell cycle checkpoints, and apoptosis. The majority of patients with A-T, a cancer-prone neurodegenerative disease, present with null mutations in Atm. To determine whether the functions of ATM are mediated solely by its kinase activity, we generated two mouse models containing single, catalytically inactivating point mutations in Atm. In this paper, we show that, in contrast to Atm-null mice, both D2899A and Q2740P mutations cause early embryonic lethality in mice, without displaying dominant-negative interfering activity. Using conditional deletion, we find that the D2899A mutation in adult mice behaves largely similar to Atm-null cells but shows greater deficiency in homologous recombination (HR) as measured by hypersensitivity to poly (adenosine diphosphate-ribose) polymerase inhibition and increased genomic instability. These results may explain why missense mutations with no detectable kinase activity are rarely found in patients with classical A-T. We propose that ATM kinase-inactive missense mutations, unless otherwise compensated for, interfere with HR during embryogenesis.


Figures

Figure 1.
Figure 1.
ATM D2899A and Q2740P mutations display severely impaired kinase activity in vitro and cause embryonic lethality in mice. (A) Pairwise local alignments of human (Homo sapiens) and mouse (Mus musculus) ATM protein sequences surrounding sites of mutagenesis. (B) Kinase assay with 0.2 nM WT, D2889A, or Q2730P mutant dimeric human ATM, 3.6 nM MRN, 50 nM GST-p53 substrate, and linear DNA probed with an antibody to p53 S15 phosphorylation. A titration of ATM is shown for each sample. (C) Sequence chromatograms showing the amino acid mutations generated in mouse BAC RP24-122F10. (D and E) Thymocytes were harvested for lysate preparation and Western blot analysis. Molecular mass markers are in kilodaltons. (F and G) Tables showing the expected and observed genotypes of 3-wk-old pups from breeding AtmTgAtm+/− with Atm+/− mice. The boxes highlight the comparison between the total number of ATM kinase-inactive and Atm-null live-born pups.
Figure 2.
Figure 2.
Conditional ATM D2899A mice display defects mildly more severe than ATM deficiency in B cell development, genome stability, and sensitivity to PARP inhibitor. (A) Western blot analysis of splenic B cells stimulated with LPS and RP105 for 72 h, FACS sorted for YFP expression, and harvested for lysate preparation after a 10-Gy irradiation. Shown for comparison are sorted cells from two individual AtmTgD2899AAtmflox/− mice. In addition to the labeled Atm genotype, note that mice are also Cd19cre/+Rosa26YFP/+, for which YFP expression (as a marker of Cre recombinase expression) is found in pro-B cells and becomes progressively higher through B cell development to the mature B cell stage. Molecular mass markers are in kilodaltons. (B) YFP+ frequency from freshly isolated B cells of the following subsets of bone marrow and spleen harvested and stained with antibodies to B220, CD43, and IgM for flow cytometric analysis. Pro-B (B220+CD43+IgM), pre-B (B220+CD43IgM), immature B (B220+CD43IgMint), mature B (B220+IgM+), and splenic mature B (B220+IgM+) are shown. *, P < 0.00001. (C) YFP+ absolute cell numbers from each subset in bone marrow and spleen. Legend same as in B. *, P < 0.05. (D) YFP+ fraction of live B220+ splenic B cells stimulated with LPS as a function of days in culture. Each data point represents the YFP+ frequency measured by flow cytometry, relative to day 0. For days 5 and 6, P < 0.0001 for AtmTgD2899AAtmflox/− versus Atmflox/+, and P < 0.05 for AtmTgD2899AAtmflox/− versus Atmflox/−. (E) Splenic YFP+ B cells stimulated with LPS, IL4, and RP105 for 72 h were harvested for metaphase chromosome preparation. FISH was performed on slides with a probe for telomeres and counterstained with DAPI. Frequency of aberrations per metaphase is shown for chromatid breaks (CTB), chromosome breaks (CSB), radials, and translocations (Atmflox/+: n = 105 from 1 mouse; AtmTgD2899AAtmflox/−: n = 313 from 3 mice; Atmflox/−: n = 200 from 2 mice). (F) YFP+ fraction of live B220+ splenic B cells stimulated with LPS and 1 µM PARP inhibitor. Each data point represents the YFP+ frequency measured by flow cytometry relative to no treatment of the same genotype. Legend same as in D. On days 3 and 4, P < 0.05 for AtmTgD2899AAtmflox/− versus Atmflox/−. Error bars represent standard deviation. PARPi, PARP inhibitor.
Figure 3.
Figure 3.
Conditional ATM D2899A B cells display defects in immunoglobulin class switching without impairing DNA-PKcs or ATR. (A) Flow cytometric analysis of IgG1 expression on B cells stimulated with LPS and IL4 for 5 d. (B) Mean percentage of IgG1 class switching from multiple flow cytometric analyses as in B (*, P < 0.05). (C) Mean percentage of IgG1 class switching of YFP+ splenic B cells treated with DNA-PKcs inhibitor NU7026 (PKi) or DMSO (*, P < 0.05). (D) Splenic B cells stimulated with LPS and RP105 for 72 h were treated with 2 mM hydroxyurea (HU) for 2 h, FACS sorted for YFP expression, and harvested for lysate preparation and Western blot analysis. Shown for comparison are sorted cells from two individual AtmTgD2899AAtmflox/− mice along with Atm+/+ and Atm−/− unsorted B cells. Molecular mass markers are in kilodaltons. Error bars represent standard deviation.

Comment in

References

    1. Adams K.E., Medhurst A.L., Dart D.A., Lakin N.D. 2006. Recruitment of ATR to sites of ionising radiation-induced DNA damage requires ATM and components of the MRN protein complex. Oncogene. 25:3894–3904 10.1038/sj.onc.1209426 - DOI - PMC - PubMed
    1. Bakkenist C.J., Kastan M.B. 2003. DNA damage activates ATM through intermolecular autophosphorylation and dimer dissociation. Nature. 421:499–506 10.1038/nature01368 - DOI - PubMed
    1. Banin S., Moyal L., Shieh S., Taya Y., Anderson C.W., Chessa L., Smorodinsky N.I., Prives C., Reiss Y., Shiloh Y., Ziv Y. 1998. Enhanced phosphorylation of p53 by ATM in response to DNA damage. Science. 281:1674–1677 10.1126/science.281.5383.1674 - DOI - PubMed
    1. Barlow C., Hirotsune S., Paylor R., Liyanage M., Eckhaus M., Collins F., Shiloh Y., Crawley J.N., Ried T., Tagle D., Wynshaw-Boris A. 1996. Atm-deficient mice: a paradigm of ataxia telangiectasia. Cell. 86:159–171 10.1016/S0092-8674(00)80086-0 - DOI - PubMed
    1. Barone G., Groom A., Reiman A., Srinivasan V., Byrd P.J., Taylor A.M. 2009. Modeling ATM mutant proteins from missense changes confirms retained kinase activity. Hum. Mutat. 30:1222–1230 10.1002/humu.21034 - DOI - PubMed

Publication types

MeSH terms