. 2012 Aug 21;109(34):13515-20.
doi: 10.1073/pnas.1210182109. Epub 2012 Aug 6.

Three-dimensional microfluidic model for tumor cell intravasation and endothelial barrier function

Affiliations

Three-dimensional microfluidic model for tumor cell intravasation and endothelial barrier function

Ioannis K Zervantonakis et al. Proc Natl Acad Sci U S A. .

Abstract

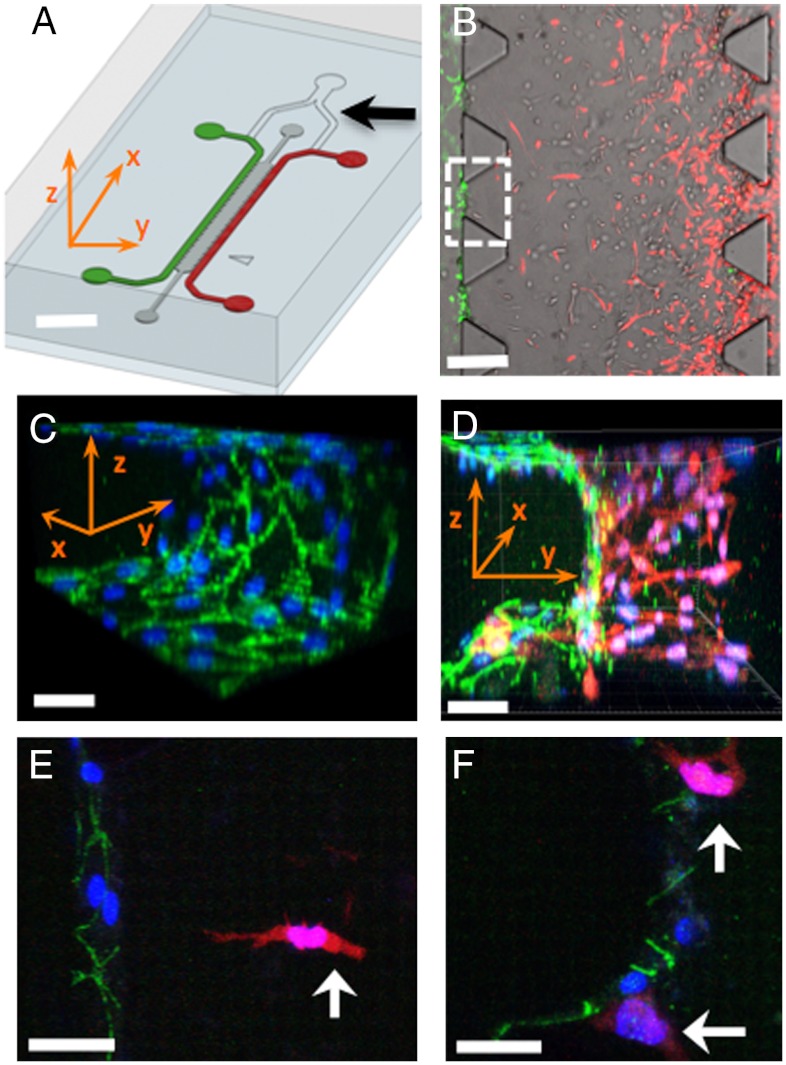
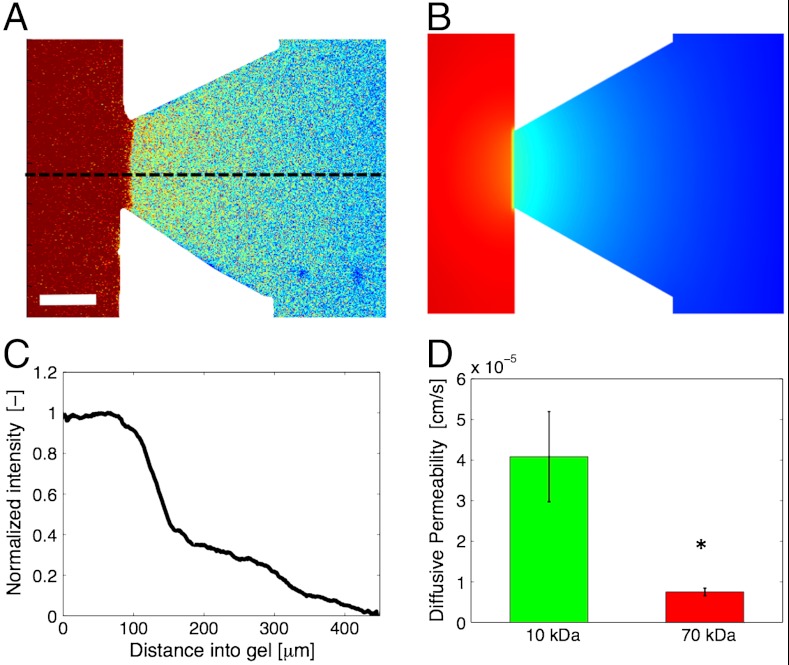
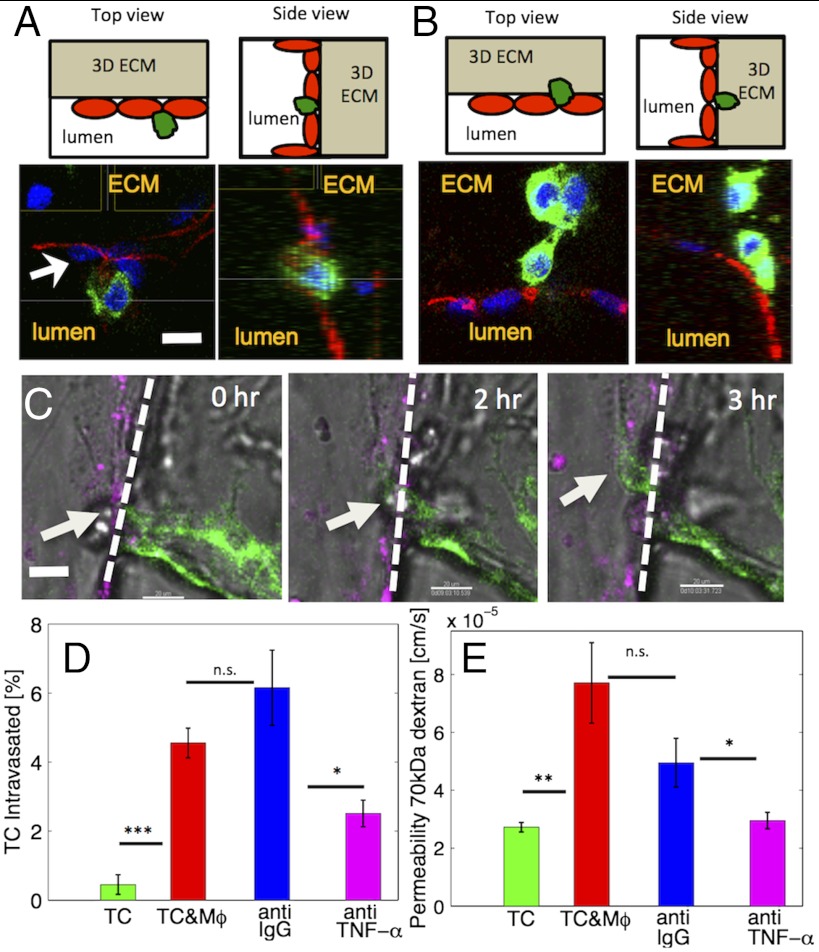
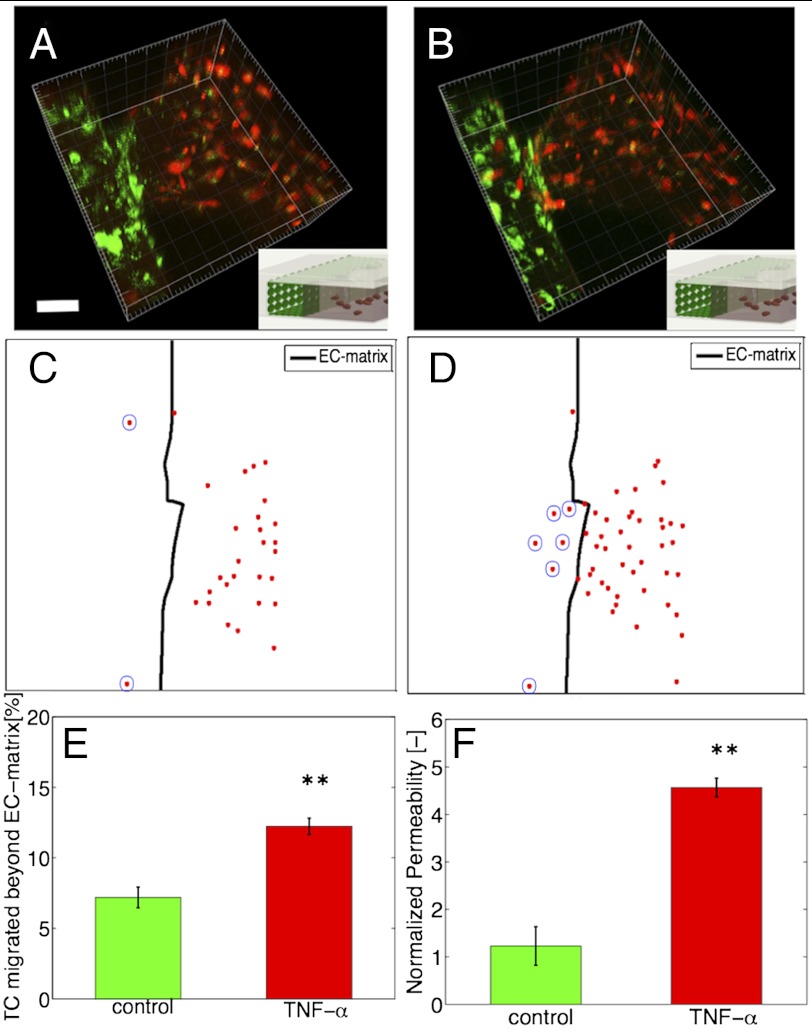
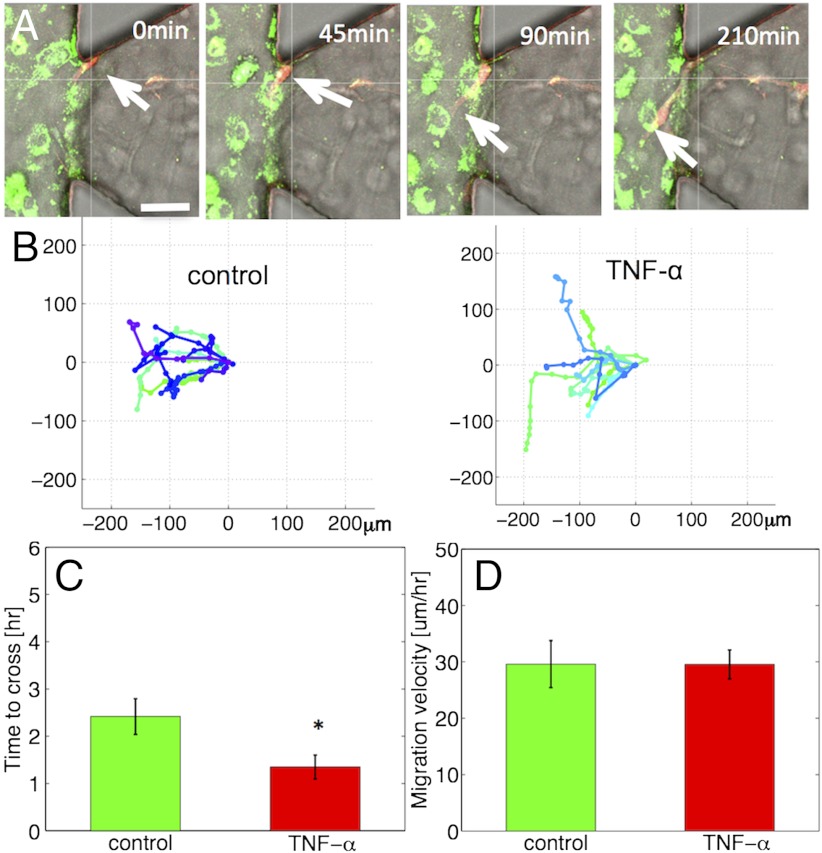
Entry of tumor cells into the blood stream is a critical step in cancer metastasis. Although significant progress has been made in visualizing tumor cell motility in vivo, the underlying mechanism of cancer cell intravasation remains largely unknown. We developed a microfluidic-based assay to recreate the tumor-vascular interface in three-dimensions, allowing for high resolution, real-time imaging, and precise quantification of endothelial barrier function. Studies are aimed at testing the hypothesis that carcinoma cell intravasation is regulated by biochemical factors from the interacting cells and cellular interactions with macrophages. We developed a method to measure spatially resolved endothelial permeability and show that signaling with macrophages via secretion of tumor necrosis factor alpha results in endothelial barrier impairment. Under these conditions intravasation rates were increased as validated with live imaging. To further investigate tumor-endothelial (TC-EC) signaling, we used highly invasive fibrosarcoma cells and quantified tumor cell migration dynamics and TC-EC interactions under control and perturbed (with tumor necrosis factor alpha) barrier conditions. We found that endothelial barrier impairment was associated with a higher number and faster dynamics of TC-EC interactions, in agreement with our carcinoma intravasation results. Taken together our results provide evidence that the endothelium poses a barrier to tumor cell intravasation that can be regulated by factors present in the tumor microenvironment.


Conflict of interest statement

The authors declare no conflict of interest.

Figures

Fig. 1.
Fig. 1.
Microfluidic tumor-vascular interface model. (A) Endothelial channel (green), tumor channel (red), and 3D ECM (dark gray) between the two channels. Channels are 500 μm wide, 20 mm in length, and 120 μm in height. Black arrow shows the y-junction. (Scale bar: 2 mm.) (B) Phase contrast image showing the fibrosarcoma cells (HT1080, red) invading through the ECM (gray) toward the endothelium (MVEC, green). A single 3D ECM hydrogel matrix region is outlined with the white dashed square. (Scale bar: 300 μm.) (C) VE-cadherin and DAPI staining to show the confluency of the endothelial monolayer on the 3D ECM (outlined with white square in B). (D) Three-dimensional rendering of a confocal z-stack of a single region showing the tumor cells invading in 3D and adhering to the endothelium. (Scale bar: 30 μm.) (E) HT1080 cell (white arrow) invading in 3D toward the endothelium. (Scale bar: 30 μm.) (F) HT1080 cells in contact with the endothelial monolayer. In CF all scale bars are 30 μm. Green, VE-cadherin; blue, DAPI; red, HT1080-mCherry. x-, y-, z- coordinate indication is appropriately adjusted in A, C, and D.
Fig. 2.
Fig. 2.
Characterization of endothelial permeability. (A) Single confocal slice showing the distribution of a 10 kDa fluorescent dextran in a 3D hydrogel ECM region. Warmer colors indicate higher fluorescent intensities. (Scale bar: 50 μm.) (B) Computational simulation of biomolecular transport under the experimental conditions of A. (C) Normalized fluorescent intensity profile along the dashed line in A illustrating the sharp drop of dextran concentration across the endothelial monolayer and the steady diffusive flux inside the 3D ECM. (D) Diffusive permeability (PD) of endothelial monolayer (MVEC) in the presence of tumor cells (HT1080) for 10 and 70 kDa dextrans. Average values across n = 10 regions within a single device; error bars represent SEM (P = 0.013). Fluorescence intensity in C was normalized with respect to the value at the starting point of the dashed line in A.
Fig. 3.
Fig. 3.
Macrophages enable tumor cell intravasation. (A) Top (Upper Left) and side (Upper Right) views showing the device schematic with the endothelial monolayer, the tumor cells, and the location of the 3D ECM. (Lower) Confocal images, demonstrating intravasation of a single breast carcinoma cell (green) across the endothelium (MVEC, stained red for VE-cadherin). (Scale bar: 30 μm.) (B) Top (Upper Left) and side (Upper Right) views with the same orientation as in A, showing tumor cells on the basal side of the endothelium. (C) Time sequence of a single confocal slices showing a breast carcinoma cell (white arrow) in the process of intravasaton across a HUVEC monolayer (magenta) in the presence of macrophages (RAW264.7). The dashed line illustrates the endothelial-ECM interface. (Scale bar: 30 μm.) (D) Percentage of carcinoma cells that intravasated across a HUVEC monolayer was increased in the presence of macrophages (Mφ, P = 6 × 10-4). Blocking TNF-α resulted in a significant reduction in intravasation compared to the IgG antibody control (P = 0.035). Average values (n = 3 devices) for each condition. (E) Quantification of endothelial permeability to 70 kDa dextrans. Presence of macrophage led to significant permeability increase (P = 0.002). TNF-α blocking also resulted in a significant reduction (P = 0.036) compared to the IgG antibody control. Average values (n = 12 regions); error-bars represent SEM.
Fig. 4.
Fig. 4.
TNF-α effects on tumor-endothelial interactions and endothelial permeability. (A and B) Three-dimensional rendering of a single hydrogel region showing fibrosarcoma tumor cells (HT1080, red) next to endothelial monolayer (MVEC, green) at time t = 0 h (A) and t = 10 h (B). Inset shows image orientation in the device. (Scale bar: 50 μm.) (C and D) Projected confocal slices showing all tumor cells (red dots) located within 250 μm from the 3D ECM-endothelial channel interface (outlined with a thick black line) at t = 0 h (C) and t = 10 h (D). (Scale bar: 50 μm.) (E) Percentage of tumor cells that interacted with the endothelium to the total cells in the hydrogel region (P = 0.006). Average values (n = 3 devices) for each condition. (F) Normalized change in permeability after 10 h, for the control and TNF-α conditions (P = 0.002). Average values for at least n = 10 hydrogel regions; error-bars represent SEM.
Fig. 5.
Fig. 5.
Dynamics of tumor-endothelial interactions. (A) Time series of confocal images showing a HT1080 cell (red, white arrow) invading toward the TNF-α stimulated endothelial monolayer (MVEC, green). (Scale bar: 50 μm.) (B) Tumor cell trajectories over 10 h under control (Left) and TNF-α conditions (Right). (C) Time required for tumor cells to migrate over a 60 μm distance across the EC-matrix (P = 0.02). (D) Mean migration speed of HT1080 cells in the 3D matrix (P = 0.99). Average values for at least n = 10 trajectories per condition in AD; error-bars represent SEM.

References

    1. Nguyen DX, Bos PD, Massague J. Metastasis: From dissemination to organ-specific colonization. Nat Rev Cancer. 2009;9:274–284. - PubMed
    1. Steeg PS. Tumor metastasis: Mechanistic insights and clinical challenges. Nat Med. 2006;12:895–904. - PubMed
    1. Friedl P, Alexander S. Cancer invasion and the microenvironment: Plasticity and reciprocity. Cell. 2011;147:992–1009. - PubMed
    1. Quigley JP, Armstrong PB. Tumor cell intravasation alu-cidated: The chick embryo opens the window. Cell. 1998;94:281–284. - PubMed
    1. Roussos ET, Condeelis JS, Patsialou A. Chemotaxis in cancer. Nat Rev Cancer. 2011;11:573–587. - PMC - PubMed

Publication types

Substances

LinkOut - more resources