. 2012 Aug 28;109(35):13934-8.
doi: 10.1073/pnas.1207728109. Epub 2012 Aug 6.

Two-year survey comparing earthquake activity and injection-well locations in the Barnett Shale, Texas

Affiliations

Two-year survey comparing earthquake activity and injection-well locations in the Barnett Shale, Texas

Cliff Frohlich. Proc Natl Acad Sci U S A. .

Abstract

Between November 2009 and September 2011, temporary seismographs deployed under the EarthScope USArray program were situated on a 70-km grid covering the Barnett Shale in Texas, recording data that allowed sensing and locating regional earthquakes with magnitudes 1.5 and larger. I analyzed these data and located 67 earthquakes, more than eight times as many as reported by the National Earthquake Information Center. All 24 of the most reliably located epicenters occurred in eight groups within 3.2 km of one or more injection wells. These included wells near Dallas-Fort Worth and Cleburne, Texas, where earthquakes near injection wells were reported by the media in 2008 and 2009, as well as wells in six other locations, including several where no earthquakes have been reported previously. This suggests injection-triggered earthquakes are more common than is generally recognized. All the wells nearest to the earthquake groups reported maximum monthly injection rates exceeding 150,000 barrels of water per month (24,000 m(3)/mo) since October 2006. However, while 9 of 27 such wells in Johnson County were near earthquakes, elsewhere no earthquakes occurred near wells with similar injection rates. A plausible hypothesis to explain these observations is that injection only triggers earthquakes if injected fluids reach and relieve friction on a suitably oriented, nearby fault that is experiencing regional tectonic stress. Testing this hypothesis would require identifying geographic regions where there is interpreted subsurface structure information available to determine whether there are faults near seismically active and seismically quiescent injection wells.


Conflict of interest statement

The author declares no conflict of interest.

Figures
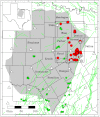
Fig. 1.
Fig. 1.
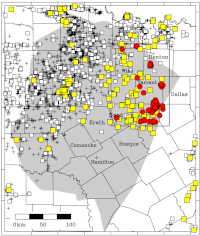
Map of Barnett Shale study area; the inset and rectangle at upper left show the area in Texas included in this map. Triangles are locations of USArray temporary seismic stations, red circles are earthquakes located in this study (Table S1), green circles are quarry blasts located in this study, and white circles are epicenters reported by the NEIC during study interval (Nov 15, 2009 to Sept 15, 2011). The gray shaded area is approximate extent of the Barnett Shale; green lines are mapped faults (18); black lines are boundaries of Texas counties; labels indicate names of counties mentioned in the text. Dallas and Fort Worth are situated in Dallas and Tarrant Counties, respectively; the town of Cleburne is in Johnson County. The rectangle in the Upper Right of figure indicates region mapped in Fig. 2.
Fig. 2.
Fig. 2.
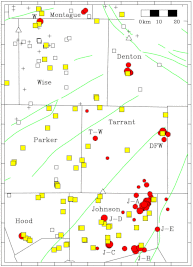
Map showing earthquake epicenters determined in this study (red circles), injection wells (squares and + symbols) in use since October 2006, seismograph stations (white triangles), and mapped faults (green lines, from ref. 16). Circle sizes indicate quality of epicentral location, with large, medium and small sizes indicating qualities A, B, and C. Labels designate events or clusters in Table 1. For injection wells, yellow squares are wells with maximum monthly injection rates exceeding 150,000 BWPM (24,000 m3/mo); white squares, exceeding 15,000 BWPM (2,400 m3/mo); + symbols, exceeding 1,500 BWPM (240 m3/mo).
Fig. 3.
Fig. 3.
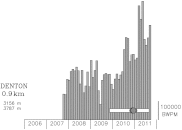
Monthly injection rates at the injection well near the Denton earthquake group identified in this study. Scale bar at right of histogram is 100,000 BWPM (16,000 m3/mo). The rectangle shows the time period of study; dark circles indicate earthquakes located in this study. Labels at Left indicate distance to epicenter and depth interval of injection. Injection rates for all other wells within 5 km of A- and B-quality epicenters are plotted in Figs. S2 and S3.
Fig. 4.
Fig. 4.
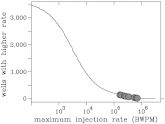
Cumulative distribution of highest monthly injection rates for wells in the region mapped in Fig. 5. The horizontal axis is the highest monthly injection rate between October 2006 and September 2011; the vertical axis is the number of wells exceeding plotted value. Dark circles correspond to maximum values for wells closest to the eight earthquake groups with A-quality epicenters identified in Fig. 2 and Table 1. Note that all eight have maximum injection rates exceeding 150,000 BWPM (24,000 m3/mo), a value exceeded by 160 wells in the mapped region (Figs. 1 and 5).
Fig. 5.
Fig. 5.
Map of Barnett Shale area as in Fig. 1, showing earthquakes located in this study (red circles) and injection wells in use since 2006 (squares and + symbols). Yellow squares are wells reporting maximum monthly injection rates exceeding 150,000 BWPM (24,000 m3/mo); white squares, exceeding 15,000 BWPM (2,400 m3/mo); + symbols, exceeding 1,500 BWPM (240 m3/mo).

Similar articles

Cited by

References

    1. Suckale J. Induced seismicity in hydrocarbon fields. Adv Geophys. 2009;51:55–106.
    1. Nicholson C, Wesson RL. Earthquake hazard associated with deep well injection: A Report to the US Environmental Protection Agency. Washington, DC: US Geological Survey Bulletin 1951; 1990.
    1. Majer EL, et al. Induced seismicity associated with enhanced geothermal systems. Geothermics. 2007;36:185–222.
    1. Davis SD, Pennington WD. Induced seismic deformation in the Cogdell oil field of West Texas. Bull Seismol Soc Am. 1989;79:1477–1495.
    1. Holland A. Examination of Possibly Induced Seismicity from Hydraulic Fracturing in the Eola Field, Garvin County, Oklahoma. Oklahoma: Oklahoma Geological Survey; 2011. p. 28. Open File Rept. OF1-2011.

Publication types