. 2012 Aug 21;109(34):13638-43.
doi: 10.1073/pnas.1211144109. Epub 2012 Aug 6.

Spatial ordering of chromosomes enhances the fidelity of chromosome partitioning in cyanobacteria

Affiliations

Spatial ordering of chromosomes enhances the fidelity of chromosome partitioning in cyanobacteria

Isha H Jain et al. Proc Natl Acad Sci U S A. .

Abstract

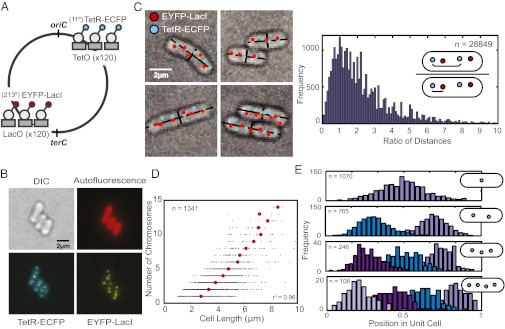
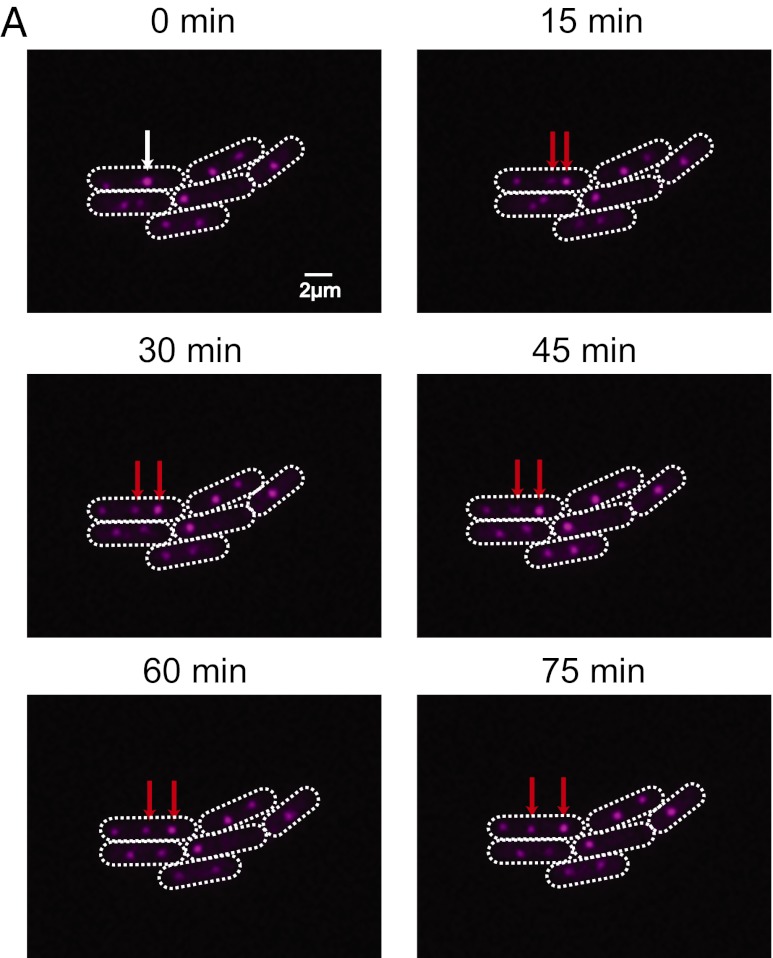
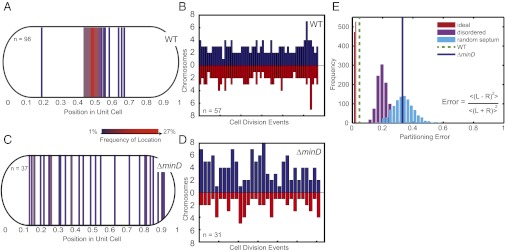
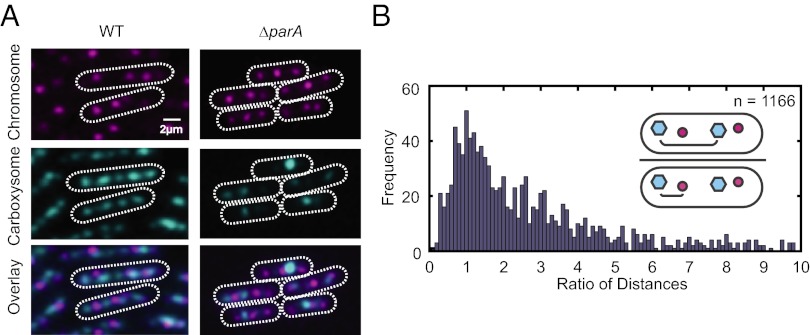
Many cyanobacteria have been shown to harbor multiple chromosome copies per cell, yet little is known about the organization, replication, and segregation of these chromosomes. Here, we visualize individual chromosomes in the cyanobacterium Synechococcus elongatus via time-lapse fluorescence microscopy. We find that chromosomes are equally spaced along the long axis of the cell and are interspersed with another regularly spaced subcellular compartment, the carboxysome. This remarkable organization of the cytoplasm along with accurate midcell septum placement allows for near-optimal segregation of chromosomes to daughter cells. Disruption of either chromosome ordering or midcell septum placement significantly increases the chromosome partitioning error. We find that chromosome replication is both asynchronous and independent of the position of the chromosome in the cell and that spatial organization is preserved after replication. Our findings on chromosome organization, replication, and segregation in S. elongatus provide a basis for understanding chromosome dynamics in bacteria with multiple chromosomes.


Conflict of interest statement

The authors declare no conflict of interest.

Figures

Fig. 1.
Fig. 1.
Chromosomes form domains and are ordered along the length of the cyanobacterial cell. (A) Genomic loci are labeled by using fluorescently tagged repressor proteins and corresponding operator arrays. The tet operator array is located at 11° and the lac operator array at 213° on the chromosome relative to the putative replication origin (oriC). The lac operator array is 33° from the putative replication terminus (terC) (6, 14). (B) Distinct genomic loci can be visualized when tagged repressors are bound to operator arrays (TetR-ECFP bound to tet operators and EYFP-LacI bound to lac operators). A single z-section is shown. (C Left) Computational identification of cells and operator arrays (cyan and red dots), and calculation of cell width and length (black lines). Multiple z-sections are used to identify chromosomes within the cell (Materials and Methods). (C Right) The distances between a given tet operator (cyan dot) and (i) the nearest tet operator (cyan dot) and (ii) the nearest lac operator (red dot) were calculated. The ratio of these distances (see schematic) is plotted as a histogram. More than 75% of ratios are greater than one, which implies that identical genomic loci are generally further apart than different genomic loci. A total of 28,849 pairs were analyzed. (D) The number of chromosome copies in a cell as a function of cell length. Red dots represent the average cell length for cells with a given number of chromosomes. The correlation between the average cell length and chromosome number is r2 = 0.96. A total of 1,341 cells were analyzed. (E) The position of chromosomes along the major axis of the cell (normalized for cell length) for cells containing one, two, three, or four chromosomes.
Fig. 3.
Fig. 3.
Chromosome replication is asynchronous within individual cells. (A) A time course of wild-type cells. A single genomic locus proximal to the origin is labeled by using tet operator arrays (pink dots). White arrows point to a replicating chromosome and red arrows point to the resulting, replicated chromosomes. A single z-section is shown.
Fig. 2.
Fig. 2.
Chromosome ordering and midcell septum formation enhance the accuracy of chromosome partitioning. (A) The site of septum formation in wild-type cells during cell division. Each line corresponds to a single cell division site, and the color represents the frequency of the septum site. (B) The number of chromosomes partitioned to pairs of daughter cells upon cell division. Each pair of bars represents a single cell division event, with the height corresponding to the number of chromosomes received by a daughter cell. (C) The site of septum formation in the ΔminD strain. (D) The number of chromosomes partitioned to pairs of daughter cells upon cell division in the ΔminD strain. (E) The partitioning error for chromosome segregation in wild-type and the ΔminD strain. Simulations of partitioning error for: (i) ideal chromosome segregation (perfect ordering and perfect midcell septa) (red histogram); (ii) disordered chromosome segregation (disordered chromosomes and wild-type distribution of septa) (purple histogram); and (iii) random septa (perfect ordering and random septa) (cyan histogram). Inset gives equation for partitioning error with R and L representing the number of chromosomes segregated to each individual right and left daughter cell pair. Brackets represent averages of all cell division events of the population.
Fig. 4.
Fig. 4.
Chromosomes and carboxysomes are spatially mutually exclusive. (A) Chromosome and carboxysome positioning in wild-type compared with parA mutants. A single z-section is shown. (B) The distances between a given carboxysome (cyan dot) and (i) the nearest carboxysome (cyan dot) and (ii) the nearest chromosome (red dot) were calculated. The ratio of these distances (see schematic) is plotted as a histogram. More than 75% of ratios are greater than one, which implies that carboxysomes are generally further apart than a carboxysome and the nearest chromosome. A total of 1,166 pairs were analyzed.

Similar articles

Cited by

References

    1. Mann N, Carr NG. Control of macromolecular composition and cell division in the blue-green algae Anacystis nidulans. J Gen Microbiol. 1974;83:399–405. - PubMed
    1. Binder BJ, Chisholm SW. Relationship between DNA cycle and growth rate in Synechococcus sp. strain PCC 6301. J Bacteriol. 1990;172:2313–2319. - PMC - PubMed
    1. Binder BJ, Chisholm SW. Cell cycle regulation in marine Synechococcus sp. strains. Appl Environ Microbiol. 1995;61:708–717. - PMC - PubMed
    1. Mori T, Binder B, Johnson CH. Circadian gating of cell division in cyanobacteria growing with average doubling times of less than 24 hours. Proc Natl Acad Sci USA. 1996;93:10183–10188. - PMC - PubMed
    1. Griese M, Lange C, Soppa J. Ploidy in cyanobacteria. FEMS Microbiol Lett. 2011;323:124–131. - PubMed

Publication types

LinkOut - more resources