

Systematic analysis of microRNA fingerprints in thrombocythemic platelets using integrated platforms
- PMID: 22869791
- PMCID: PMC3482865
- DOI: 10.1182/blood-2012-02-411264
Systematic analysis of microRNA fingerprints in thrombocythemic platelets using integrated platforms
Abstract
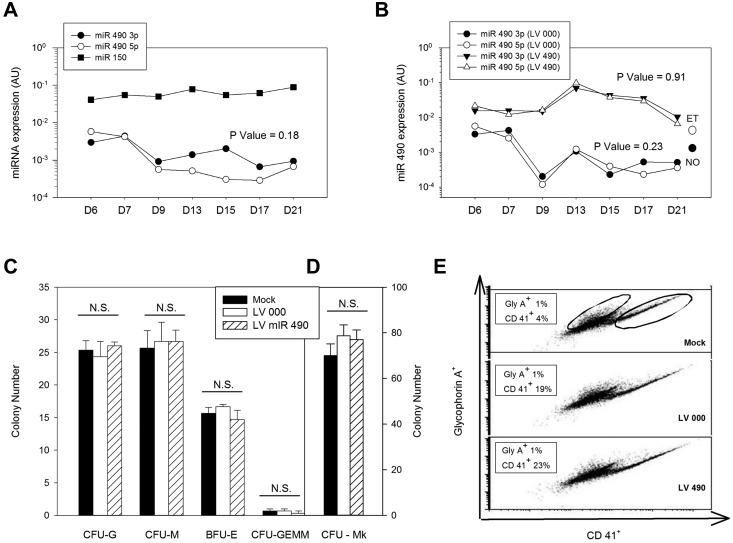
Posttranscriptional and translational controls mediated by microRNAs (miRNA) regulate diverse biologic processes. We dissected regulatory effects of miRNAs relevant to megakaryocytopoiesis and platelet biology by analyzing expression patterns in 79 subjects with thrombocytosis and controls, and integrated data with transcriptomic and proteomic platforms. We validated a unique 21-miRNA genetic fingerprint associated with thrombocytosis, and demonstrated that a 3-member subset defines essential thrombocythemia (ET). The genetic signature includes functional guide and passenger strands of the previously uncharacterized miR 490 (5p and 3p), which displayed restricted, low-level expression in megakaryocytes/platelets (compared with leukocytes), and aberrant expression during thrombocytosis, most profound in ET. Overexpression of miR 490 in a bilineage differentiation model of megakaryocyte/erythroid progenitor formation was insufficient for hematopoietic colony differentiation and/or lineage specification. Integration of transcriptomic and mass spectrometric datasets with functional reporter assays identified dishevelled associated activator of morphogenesis 1 (DAAM1) as a miR 490 5p protein target demonstrating decreased expression in ET platelets, putatively by translational control (and not by mRNA target degradation). Our data define a dysregulated miRNA fingerprint in thrombocytosis and support a developmentally restricted function of miR 490 (and its putative DAAM1 target) to conditions associated with exaggerated megakaryocytopoiesis and/or proplatelet formation.
Figures


Similar articles
-
miR-125a-5p regulates megakaryocyte proplatelet formation via the actin-bundling protein L-plastin.Blood. 2020 Oct 8;136(15):1760-1772. doi: 10.1182/blood.2020005230. Blood. 2020. PMID: 32844999 Free PMC article.
-
Platelet microRNA expression and association with platelet maturity and function in patients with essential thrombocythemia.Platelets. 2020;31(3):365-372. doi: 10.1080/09537104.2019.1636019. Epub 2019 Jun 26. Platelets. 2020. PMID: 31240987
-
MicroRNAs in platelet production and activation.Blood. 2011 May 19;117(20):5289-96. doi: 10.1182/blood-2011-01-292011. Epub 2011 Mar 1. Blood. 2011. PMID: 21364189 Free PMC article. Review.
-
MYB controls erythroid versus megakaryocyte lineage fate decision through the miR-486-3p-mediated downregulation of MAF.Cell Death Differ. 2015 Dec;22(12):1906-21. doi: 10.1038/cdd.2015.30. Epub 2015 Apr 10. Cell Death Differ. 2015. PMID: 25857263 Free PMC article.
-
MicroRNA function in megakaryocytes.Platelets. 2019;30(7):809-816. doi: 10.1080/09537104.2018.1528343. Epub 2018 Oct 25. Platelets. 2019. PMID: 30359163 Review.
Cited by
-
Platelet microRNA-15b protects against high platelet reactivity in patients undergoing percutaneous coronary intervention through Bcl-2-mediated platelet apoptosis.Ann Transl Med. 2020 Mar;8(6):364. doi: 10.21037/atm.2020.02.88. Ann Transl Med. 2020. PMID: 32355808 Free PMC article.
-
MicroRNA expression differences in human hematopoietic cell lineages enable regulated transgene expression.PLoS One. 2014 Jul 16;9(7):e102259. doi: 10.1371/journal.pone.0102259. eCollection 2014. PLoS One. 2014. PMID: 25029370 Free PMC article.
-
Platelets miRNA as a Prediction Marker of Thrombotic Episodes.Dis Markers. 2016;2016:2872507. doi: 10.1155/2016/2872507. Epub 2016 Nov 30. Dis Markers. 2016. PMID: 28042196 Free PMC article. Review.
-
Small molecule BLVRB redox inhibitor promotes megakaryocytopoiesis and stress thrombopoiesis in vivo.Nat Commun. 2025 Apr 11;16(1):3480. doi: 10.1038/s41467-025-58497-9. Nat Commun. 2025. PMID: 40216753 Free PMC article.
-
Proteomics: A Tool to Study Platelet Function.Int J Mol Sci. 2021 Apr 30;22(9):4776. doi: 10.3390/ijms22094776. Int J Mol Sci. 2021. PMID: 33946341 Free PMC article. Review.
References
-
- Krol J, Loedige I, Filipowicz W. The widespread regulation of miRNA biogenesis, function and decay. Nat Rev Genet. 2010;11(9):597–610. - PubMed
-
- Merkerova M, Belickova M, Bruchova H. Differential expression of microRNAs in hematopoietic cell lineages. Eur J Haematol. 2008;81(4):304–310. - PubMed
-
- Girardot M, Pecquet C, Boukour S, et al. miR-28 is a thrombopoietin receptor targeting microRNA detected in a fraction of myeloproliferative neoplasm patient platelets. Blood. 2010;116(3):437–445. - PubMed
Publication types
MeSH terms
Substances
Grants and funding
LinkOut - more resources
Full Text Sources
Molecular Biology Databases
