. 2012;10(7):e1001368.
doi: 10.1371/journal.pbio.1001368. Epub 2012 Jul 31.

The evolutionary consequences of blood-stage vaccination on the rodent malaria Plasmodium chabaudi

Affiliations

The evolutionary consequences of blood-stage vaccination on the rodent malaria Plasmodium chabaudi

Victoria C Barclay et al. PLoS Biol. 2012.

Abstract

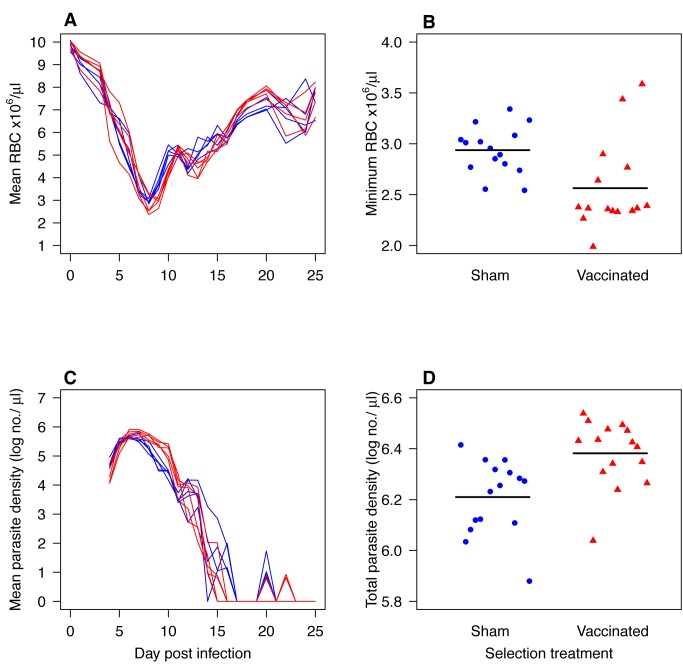
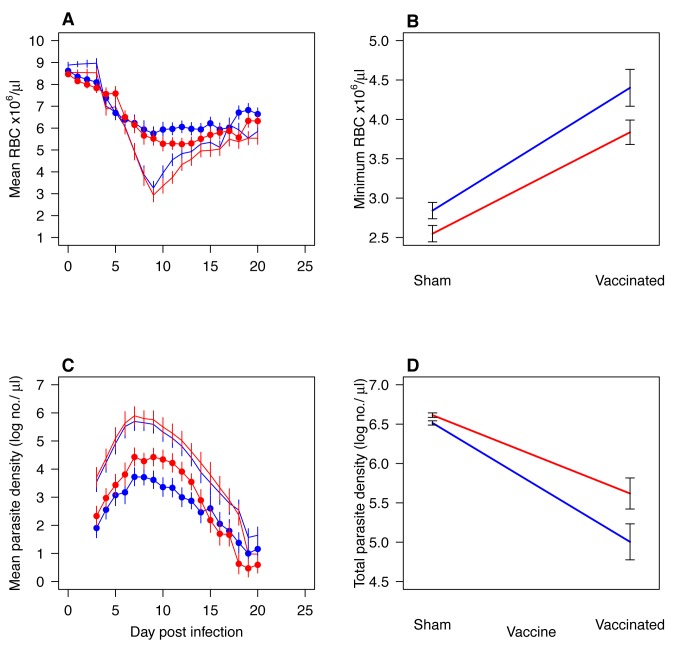
Malaria vaccine developers are concerned that antigenic escape will erode vaccine efficacy. Evolutionary theorists have raised the possibility that some types of vaccine could also create conditions favoring the evolution of more virulent pathogens. Such evolution would put unvaccinated people at greater risk of severe disease. Here we test the impact of vaccination with a single highly purified antigen on the malaria parasite Plasmodium chabaudi evolving in laboratory mice. The antigen we used, AMA-1, is a component of several candidate malaria vaccines currently in various stages of trials in humans. We first found that a more virulent clone was less readily controlled by AMA-1-induced immunity than its less virulent progenitor. Replicated parasites were then serially passaged through control or AMA-1 vaccinated mice and evaluated after 10 and 21 rounds of selection. We found no evidence of evolution at the ama-1 locus. Instead, virulence evolved; AMA-1-selected parasites induced greater anemia in naïve mice than both control and ancestral parasites. Our data suggest that recombinant blood stage malaria vaccines can drive the evolution of more virulent malaria parasites.


Conflict of interest statement

The authors have declared that no competing interests exist.

Figures

Figure 1
Figure 1. Virulence and densities of P. c. adami parasites that had undergone 30 passages in naïve mice (derived) with their progenitors (ancestral) (“evaluation experiment 1”).
Curves (panels A and C) represent the kinetics in up to four mice (mean ± 1 s.e.m.) that were sham-vaccinated (no symbols) or AMA-1 vaccinated (filled circles) and infected with derived (red) or ancestral parasites (blue). Interaction plots (panels B and D) show minimum parasite densities and red cell densities in sham- or AMA-1-vaccinated mice infected with ancestral parasites (blue lines) or derived parasites (red lines). Derived parasites induced more anaemia and achieved higher parasite densities than ancestral parasites during infection of naïve mice (A–D; anemia F 1,6 = 6.5, p = 0.04, parasites F 1,6 = 22.3, p = 0.003) and AMA-1 vaccination was disproportionately less effective at containing the derived parasites (C–D; total parasite density×vaccination: F 1,12 = 5.4, p = 0.03).
Figure 2
Figure 2. Virulence and densities in naïve mice of parasites that had previously been serially passaged 10 times through mice that were sham-vaccinated or AMA-1 vaccinated (“evaluation experiment 2”).
Curves (A and C) show the kinetics of five C-lines (blue) and five V-lines (red) each assayed in up to three mice. Points on the scatterplots (B and D) are individual mice infected with C-lines (filled blue circles) or V-lines (filled red triangles). Horizontal black lines indicate mean values. V-lines induced more anemia (A–B; F 1,28 = 8.4, p = 0.007) and reached higher total parasite densities than their comparator C-lines (C–D; F 1,28 = 11.5, p = 0.002).
Figure 3
Figure 3. Virulence and densities in naïve mice of parasites that had previously been serially passaged 21 times through mice that were sham-vaccinated or AMA-1 vaccinated, together with the progenitor parasites (ancestral) (“evaluation experiment 3”).
Curves (A and C) show the kinetics of five C-lines (blue) and five V-lines (red) each assayed in up to three mice. Black curve is the mean of nine mice infected with the ancestral lineage. Points on the scatterplots (B and D) are individual mice infected with ancestral parasites (filled black diamonds), C-lines (filled blue circles), or V-lines (filled red triangles). Horizontal black lines indicate mean values. V-line parasites caused more anemia than the C-lines and ancestral parasites (A–B; F 1,27 = 6.2, p = 0.02 and F 1,22 = 8.2, p = 0.008, respectively). The V-lines also reached higher total parasite densities than the ancestral parasites (C–D; F 1,22 = 12.3, p = 0.002), but the C-lines and V-lines did not differ from each other (C–D; F 1,27 = 1.6, p = 0.2).
Figure 4
Figure 4. Virulence and densities of parasites that had been serially passaged 21 times in sham-vaccinated and AMA-1-vaccinated mice when assayed in sham-vaccinated or AMA-1-vaccinated mice (“evaluation experiment 4”).
Curves (A and C) represents the kinetics (mean ±1 s.e.m.) of five C-lines (blue) and five V-lines (red) when assayed in sham-vaccinated (no symbol) or AMA-1-vaccinated (filled circles) mice. The interaction plots show the minimum RBC (B) and total asexual parasite densities (D) reached during infection of sham- or AMA-1-vaccinated mice with C-lines (blue line) or V-lines (red line). During infection of sham- and AMA-1-vaccinated mice, V-lines induced more anemia than C-lines (A–B; F 1,38 = 4.0, p = 0.05 and F 1,38 = 4.0, p = 0.05, respectively), but the magnitude was not significant (A–B; anemia, parasite×vaccination: F 1,76 = 1.0, p = 0.3). V-lines and C-lines performed equally well in sham-vaccinated hosts (C–D: F 1,76 = 1.0, p = 0.3), and although V-lines achieved higher densities in AMA-1-vaccinated hosts (C–D; F 1,38 = 3.9, p = 0.05), the difference was not significant (Figure 4E–F; parasite×vaccination: F 1,38 = 1.9, p = 0.1).

Comment in

  • When malaria slips a vaccine's net.
    Sedwick C. Sedwick C. PLoS Biol. 2012;10(7):e1001370. doi: 10.1371/journal.pbio.1001370. Epub 2012 Jul 31. PLoS Biol. 2012. PMID: 22870064 Free PMC article. No abstract available.

References

    1. Hyde JE (2005) Drug-resistant malaria. Trends Parasitol 21: 494–498. - PMC - PubMed
    1. Enserink M (2008) Signs of drug resistance rattle experts, trigger bold plan. Science 322: 1776. - PubMed
    1. Yewhalaw D, Wassie F, Steurbaut W, Spanoghe P, Van Bortel W, et al. (2011) Multiple insecticide resistance: an impediment to insecticide-based malaria vector control program. PLoS One 6: e16066 doi:10.1371/journal.pone.0016066. - DOI - PMC - PubMed
    1. Ranson H, N'Guessan R, Lines J, Moiroux N, Nkuni Z, et al. (2011) Pyrethroid resistance in African anopheline mosquitoes: what are the implications for malaria control? Trends Parasitol 27: 91–98. - PubMed
    1. Crompton PD, Pierce SK, Miller LH (2010) Advances and challenges in malaria vaccine development. J Clin Invest 120: 4168–4178. - PMC - PubMed

Publication types

MeSH terms