Clinical Trial
. 2012;7(8):e40222.
doi: 10.1371/journal.pone.0040222. Epub 2012 Aug 1.

Laropiprant attenuates EP3 and TP prostanoid receptor-mediated thrombus formation

Affiliations
Clinical Trial

Laropiprant attenuates EP3 and TP prostanoid receptor-mediated thrombus formation

Sonia Philipose et al. PLoS One. 2012.

Abstract

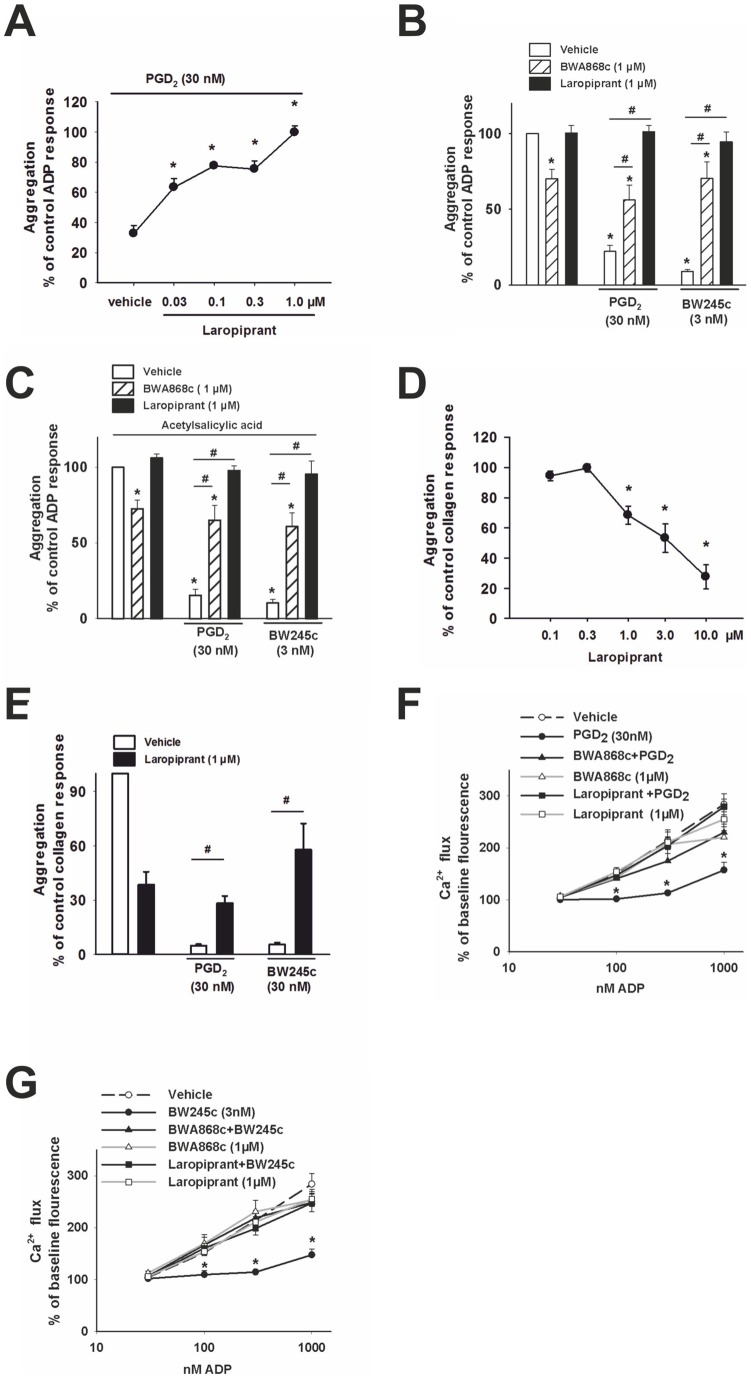
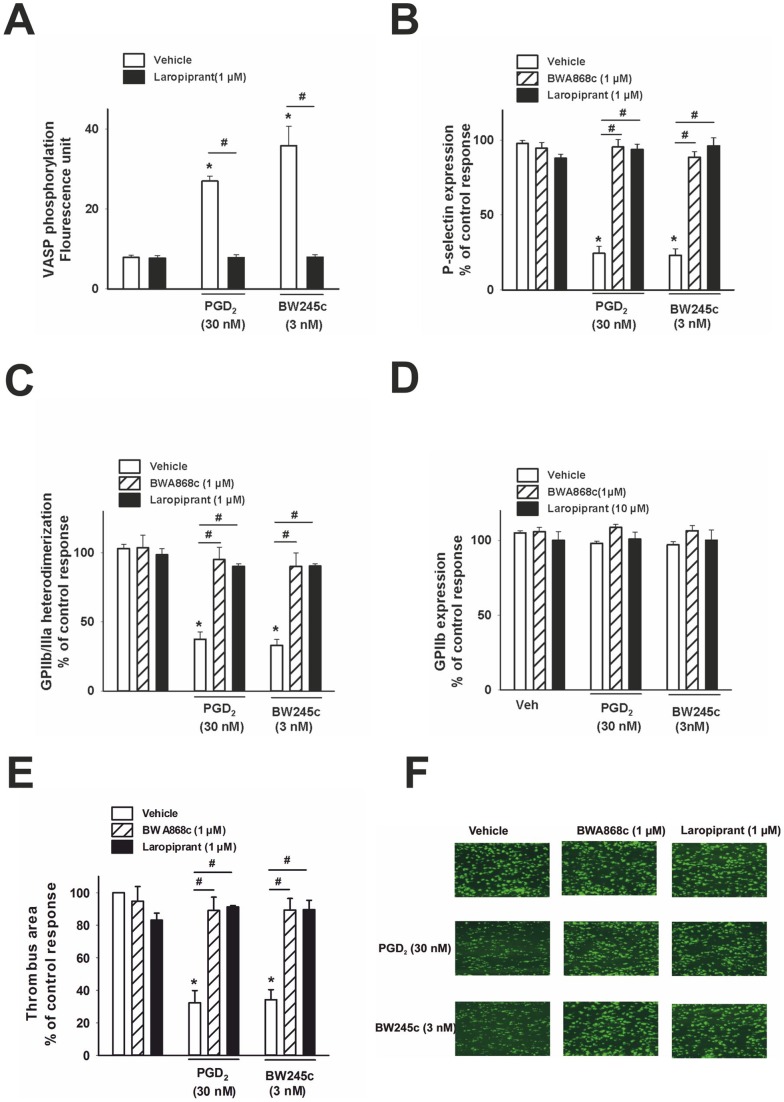
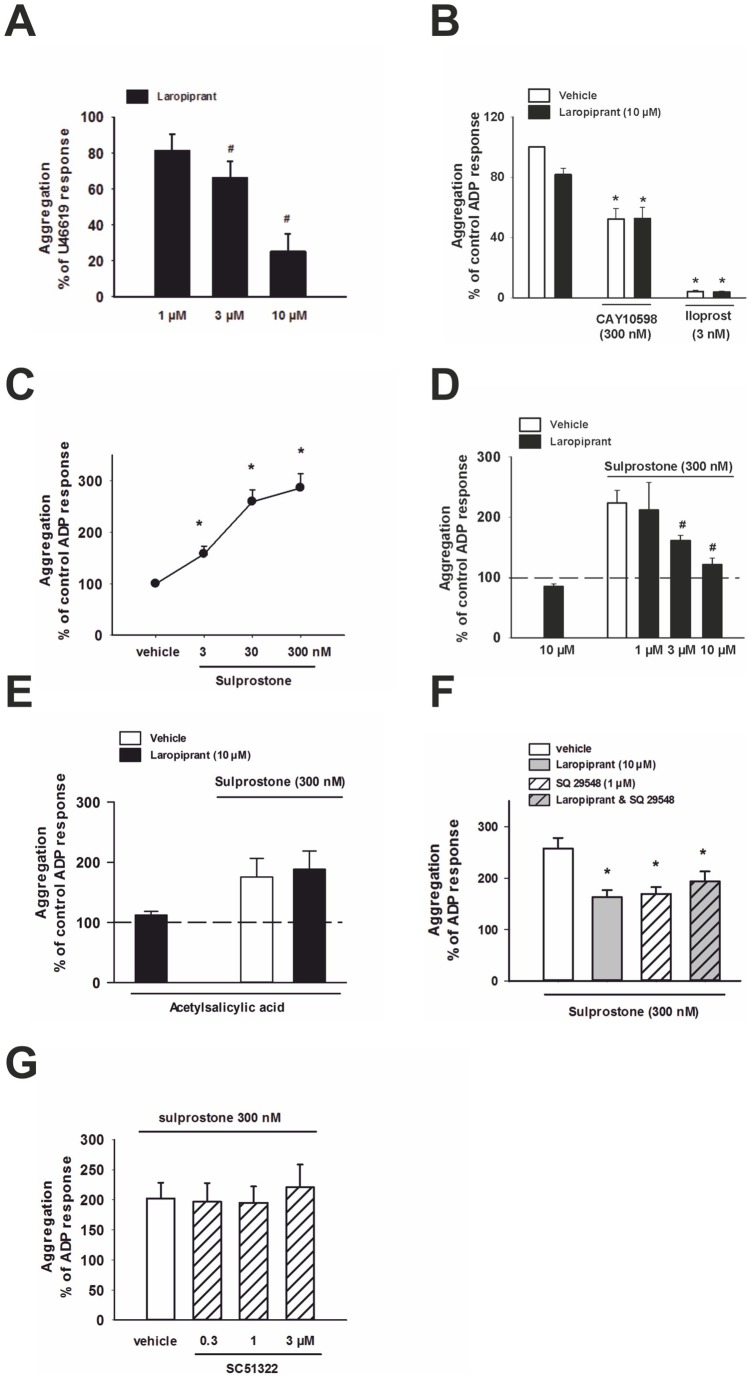
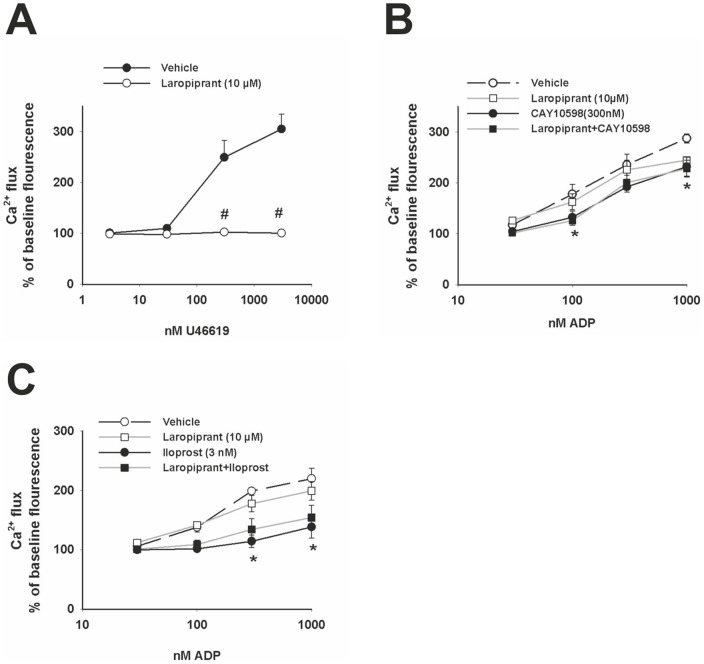
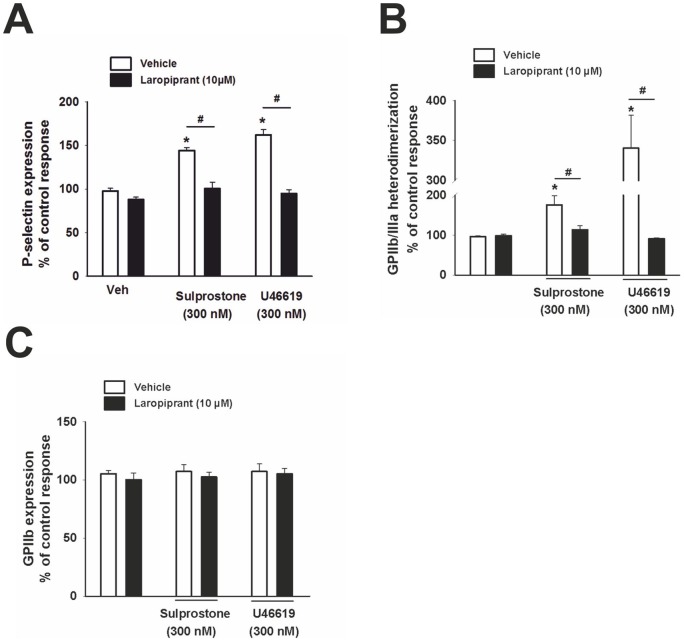
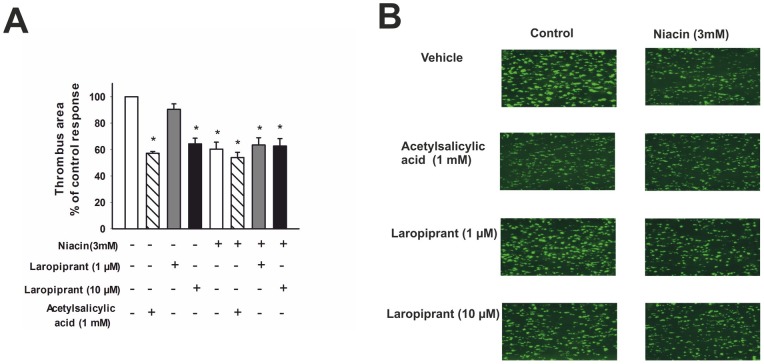
The use of the lipid lowering agent niacin is hampered by a frequent flush response which is largely mediated by prostaglandin (PG) D(2). Therefore, concomitant administration of the D-type prostanoid (DP) receptor antagonist laropiprant has been proposed to be a useful approach in preventing niacin-induced flush. However, antagonizing PGD(2), which is a potent inhibitor of platelet aggregation, might pose the risk of atherothrombotic events in cardiovascular disease. In fact, we found that in vitro treatment of platelets with laropiprant prevented the inhibitory effects of PGD(2) on platelet function, i.e. platelet aggregation, Ca(2+) flux, P-selectin expression, activation of glycoprotein IIb/IIIa and thrombus formation. In contrast, laropiprant did not prevent the inhibitory effects of acetylsalicylic acid or niacin on thrombus formation. At higher concentrations, laropiprant by itself attenuated platelet activation induced by thromboxane (TP) and E-type prostanoid (EP)-3 receptor stimulation, as demonstrated in assays of platelet aggregation, Ca(2+) flux, P-selectin expression, and activation of glycoprotein IIb/IIIa. Inhibition of platelet function exerted by EP4 or I-type prostanoid (IP) receptors was not affected by laropiprant. These in vitro data suggest that niacin/laropiprant for the treatment of dyslipidemias might have a beneficial profile with respect to platelet function and thrombotic events in vascular disease.


Conflict of interest statement

Competing Interests: The authors have declared that no competing interests exist.

Figures

Figure 1
Figure 1. DP receptor activation inhibits platelet aggregation and intracellular Ca2+ mobilization, effects that are counteracted by laropiprant.
(A–E) Aggregation was induced using ADP or collagen at concentrations which were adjusted to give submaximal aggregation. Data were expressed as percent of the control response. (A) ADP-induced aggregation was inhibited by PGD2 (30 nmol/L) and this effect was concentration dependently counteracted by laropiprant (n = 6). (B) The ADP- induced aggregation was slightly reduced by the DP receptor antagonist BWA868c (1 μmol/L), but not by laropiprant (1 μmol/L) alone. PGD2 (30 nmol/L) and the DP agonist, BW245c (3 nmol/L) caused pronounced inhibition of platelet aggregation and these effects were reversed by BWA868c and laropiprant (n = 4). (C) Pre-treatment of platelets with acetylsalicylic acid (1 mmol/L) did not affect the inhibitory effects of PGD2 (30 nmol/L) and BW245c (3 nmol/L) and the reversal of these effects by BWA868c and laropiprant at 1 μmol/L (n = 4). (D) Laropiprant caused a concentration-dependent inhibition of collagen-induced aggregation (n = 6). (E) Laropiprant (1 μmol/L) counteracted the inhibition of aggregation by PGD2 (30 nmol/L) and BW245c (3 nmol/L) (n = 4–6). (F, G) Ca2+ responses were detected by flow cytometry as changes in fluorescence of the Ca2+-sensitive dye Fluo-3 by and are presented as percent of baseline fluorescence. Ca2+ flux induced by ADP (30–1000 nmol/L) was significantly reduced by pre-treatment of platelets with (E) PGD2 (30 nmol/L) and (F) BW245c (3 nmol/L). The inhibition of the Ca2+ flux by DP receptor activation was reversed by laropiprant (1 μmol/L) and the DP antagonist, BWA868c (1 μmol/L) (n = 6). Values are shown as mean+SEM. *P<0.05 as compared to vehicle and # P<0.05 as compared to agonist treatment.
Figure 2
Figure 2. DP receptor activation increases VASP phosphorylation, and inhibits P-selectin expression, GPIIb/IIIa activation and in vitro thrombus formation. (A)
VASP phosphorylation was visualized using an anti-VASP p-Ser 157 antibody in flow cytometry and data were expressed in fluorescence units. VASP phosphorylation in platelets stimulated with ADP (3 µmol/L) was significantly enhanced by PGD2 (30 nmol/L) as well as the DP agonist BW245c (3 nmol/L), which was completely prevented by pre-treatment of platelets with laropiprant (1 μmol/L) (n = 4). (B) ADP (3 μmol/L) increased the surface expression of P-selectin, detected using a CD62P antibody, in platelets primed with cytochalasin B (5 μg/mL). PGD2 (30 nmol/L) and BW245c (3 nmol/L) caused a significant inhibition of P-selectin expression on the platelet surface and this effect was revoked by pre-treatment with DP antagonists, BWA868c (1 μmol/L) and laropiprant (1 μmol/L; n = 6). (C) The ADP (3 μmol/L) induced activation of GPIIb/IIIa, detected using a conformation dependent antibody PAC-1, was attenuated by PGD2 (30 nmol/L) and the DP agonist BW245c (3 nmol/L). These effects were reversed by BWA868c and laropiprant at 1 μmol/L (n = 6). (D) GPIIb expression was determined using an anti-CD41 antibody by flow cytometry. None of the treatments affected the GPIIb expression. Data were expressed as percent of control ADP response. (E) Whole blood incubated with the fluorescent dye 3,3′-dihexyloxacarbocyanine iodide was perfused over collagen-coated channels and thrombus formation was recorded by fluorescence microscopy. Thrombus-covered area was calculated by computerized image analysis and is expressed as percent of control (vehicle) response. Vehicle-treated samples showed pronounced thrombogenesis over collagen. Both PGD2 (30 nmol/L) and BW245c (3 nmol/L) markedly decreased the formation of thrombi. The DP antagonist BWA868c and laropiprant (1 µmol/L each) had no effect on thrombus formation by themselves but reversed the inhibition of thrombogenesis by DP receptor stimulation (n = 4). (F) Original fluorescence images. Values are shown as mean+SEM. *P<0.05 as compared to vehicle and # P<0.05 as compared to agonist treatment.
Figure 3
Figure 3. Laropiprant antagonizes the increased platelet aggregation by TP and EP3 receptor activation
In (A), aggregation was induced by U46619 (300 nmol/L) which was concentration-dependently inhibited by laropiprant (n = 4). In B–G, ADP concentrations (1.25–10 μmol/L) were adjusted to give 30–50% of maximal aggregation. (B) The inhibiton of ADP-induced aggregation by the EP4 agonist CAY10598 (300 nmol/L) and the IP agonist iloprost (3 nmol/L) was not affected by laropiprant (10 nmol/L, (n = 7)). (C) The EP3 agonist sulprostone concentration dependently amplified ADP-induced aggregation (n = 4–6). (D) The effect of sulprostone (300 nmol/L) was concentration dependently inhibited by laropiprant (n = 4). (E) Pretreatment with acetylsalicylic acid (1 mmol/L) markedly attenuated the pro-aggregatory effect of sulprostone, and in this case, laropiprant was unable to reverse the stimulatory effect of the EP3 agonist. Data were expressed as percent of control response. (F) The TP receptor antagonist SQ29578 (1 µmol/L) inhibited the sulprostone-induced increase in platelet aggregation to the same extend as laropiprant (10 µmol/L). The combination of SQ29578 and laropiprant did not cause further inhibition as compared to laropiprant or SQ29578 alone (n = 4–6) (G) The pro-aggregatory effect of sulprostone was not inhibited by the EP1 receptor antagonist SC51322 (n = 4). Data were expressed as percent of control ADP response and are shown as mean+SEM. *P<0.05 as compared to vehicle and #P<0.05 as compared to the respective agonist treatment.
Figure 4
Figure 4. Laropiprant antagonizes Ca2+ mobilization induced by TP receptor activation.
Ca2+ responses were detected by flow cytometry as changes in fluorescence of the Ca2+ -sensitive dye Fluo-3 by flow cytometry and are presented as percent of baseline fluorescence. (A) The TP agonist, U46619 (3–3000 nmol/L), induced Ca2+flux in a concentration-dependent manner and this effect was completely inhibited by laropiprant at 10 μmol/L (n = 6). (B) The EP4 receptor agonist CAY10598 (300 nmol/L) and (C) the IP receptor agonist iloprost (3 nmol/L) caused a significant inhibition of the ADP-induced Ca2+ flux (n = 4). Laropiprant (10 µmol/L) did not antagonize these effects (n = 4). Values are shown as mean+SEM. *P<0.05 as compared to vehicle and #P<0.05 as compared to the respective agonist treatment treatment.
Figure 5
Figure 5. Laropiprant antagonizes the P-selectin expression and GPIIb/IIIa activation induced by TP and EP3 receptor activation. (A)
ADP (3 μmol/L) increased the surface expression of P-selectin in platelets primed with cytochalasin B (5 μg/mL), detected using a CD62P antibody. The EP3 agonist sulprostone (300 nmol/L) and U46619 (300 nmol/L) elevated P-selectin expression on the surface of platelets. These effects were counteracted by laropiprant at 10 μmol/L (n = 5). (B) The ADP (3 μmol/L) induced activation of GPIIb/IIIa, detected using a conformation-dependent antibody, PAC-1, was increased by sulprostone (300 nmol/L) and U46619 (300 nmol/L). Laropiprant at 10 µmol/L antagonized these effects (n = 5). (C) GPIIb expression was determined using an anti-CD41 antibody by flow cytometry. None of the treatments affected the GPIIb expression (n = 5). Data were expressed as percentage of ADP control response and are shown as mean+SEM. *P<0.05 as compared to vehicle and # P<0.05 as compared to the respective agonist treatment.
Figure 6
Figure 6. Laropiprant at 10 µmol/L and niacin inhibit in vitro thrombus formation.
Whole blood was incubated with the fluorescent dye 3,3′-dihexyloxacarbocyanine iodide, perfused over collagen-coated channels, and thrombus formation was recorded by fluorescence microscopy. The images were taken 3 minutes after the start of the perfusion and are representative of 4 different experiments. (A) Vehicle-treated samples showed pronounced and rapid thrombogenesis over collagen. Treatment of whole blood with acetylsalicylic acid (1 mmol/L), laropiprant 10 µmol/L and niacin 3 mmol/L for 30 min, caused a marked reduction of thrombus formation, while laropiprant 1 µmol/L had no effect. The antithrombotic effect of niacin was not influenced by pretreatment of blood with acetylsalicylic acid or laropiprant. Thrombus-covered area was calculated by computerized image analysis and is expressed as percent of control (vehicle) response. (B) Original fluorescence images. Values are shown as mean+SEM. *P<0.05 versus vehicle.

Similar articles

Cited by

References

    1. Armstrong RA (1996) Platelet prostanoid receptors. Pharmacol Ther 72: 171–91. - PubMed
    1. Svensson J, Hamberg M, Samuelsson B (1976) On the formation and effects of thromboxane A2 in human platelets. Acta Physiol Scand 98: 285–94. - PubMed
    1. Vane JR, Botting RM (1995) Pharmacodynamic profile of prostacyclin. Am J Cardiol 75: 3A–10A. - PubMed
    1. Bishop-Bailey D, Pepper JR, Haddad EB, Newton R, Larkin SW, et al. (1997) Induction of cyclooxygenase-2 in human saphenous vein and internal mammary artery. Arterioscler Thromb Vasc Biol 17: 1644–8. - PubMed
    1. Bishop-Bailey D, Pepper JR, Larkin SW, Mitchell JA (1998) Differential induction of cyclooxygenase-2 in human arterial and venous smooth muscle: role of endogenous prostanoids. Arterioscler Thromb Vasc Biol 18: 1655–61. - PubMed

Publication types

MeSH terms