. 2012 Jul;2(7):120091.
doi: 10.1098/rsob.120091.

Systems analysis of transcription factor activities in environments with stable and dynamic oxygen concentrations

Collaborators, Affiliations

Systems analysis of transcription factor activities in environments with stable and dynamic oxygen concentrations

Matthew D Rolfe et al. Open Biol. 2012 Jul.

Abstract

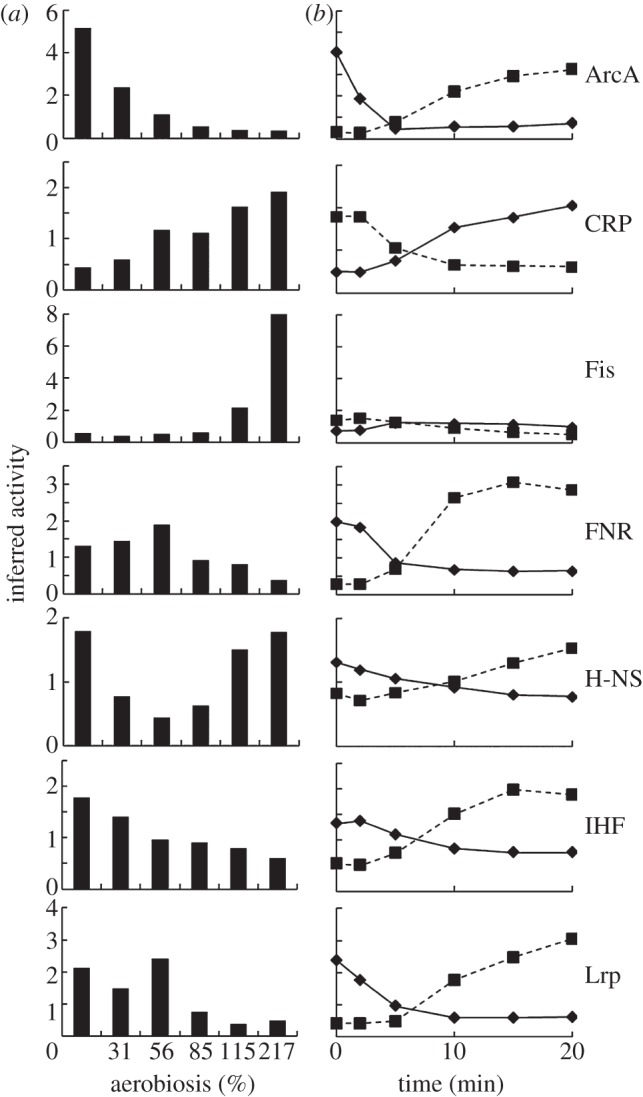
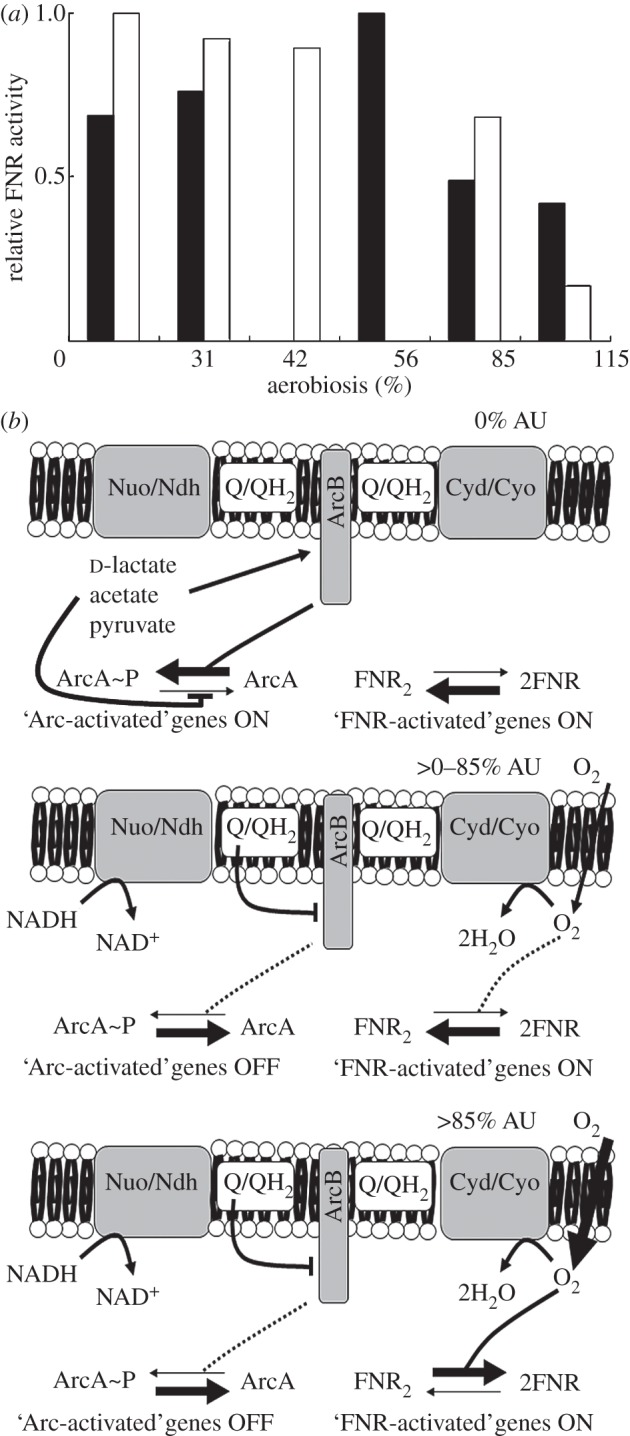
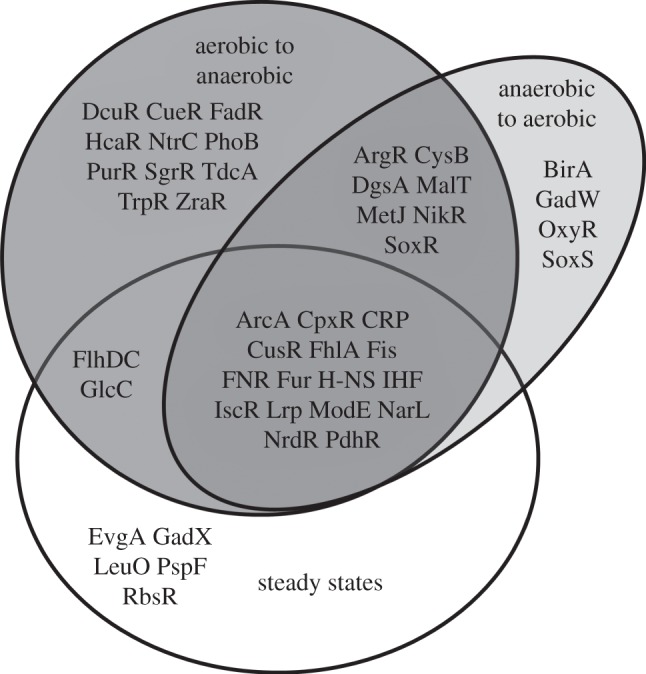
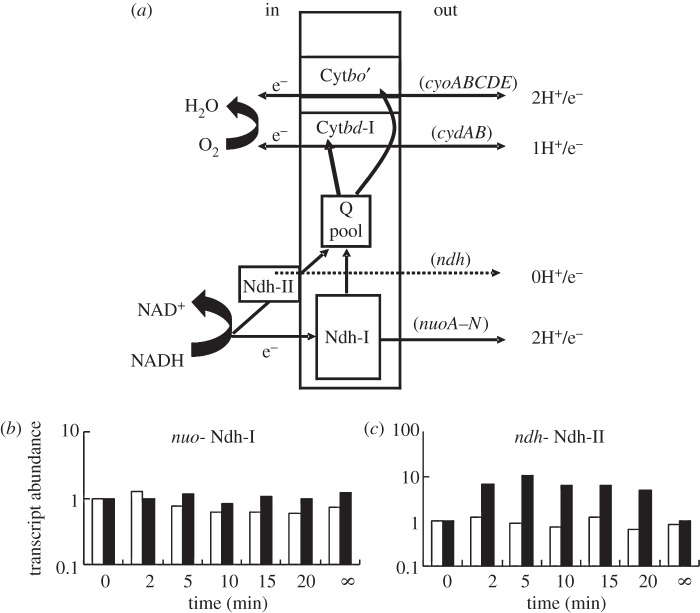
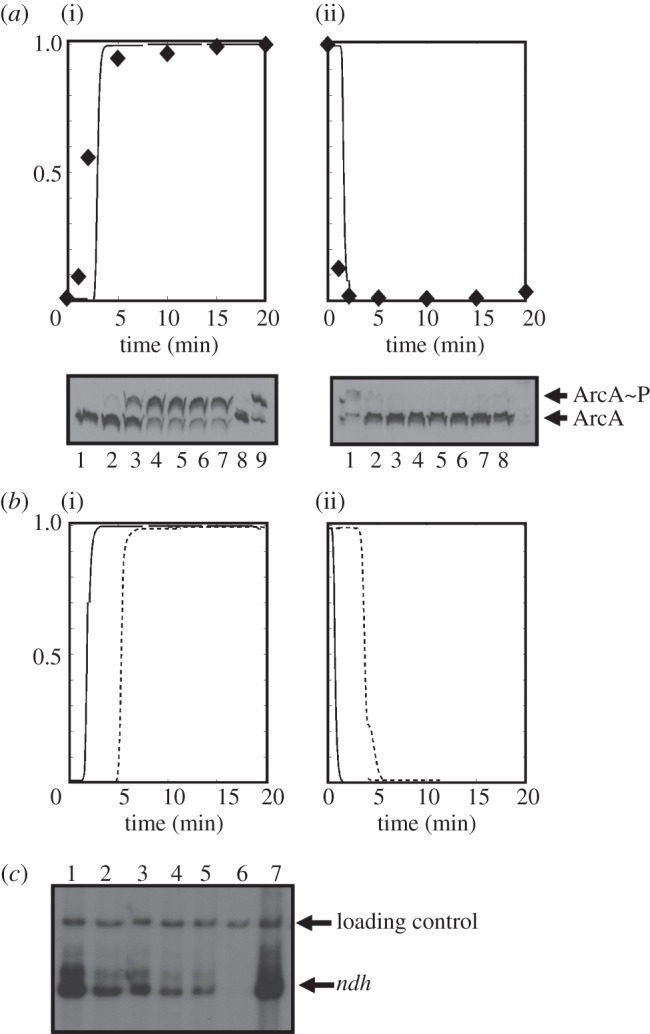
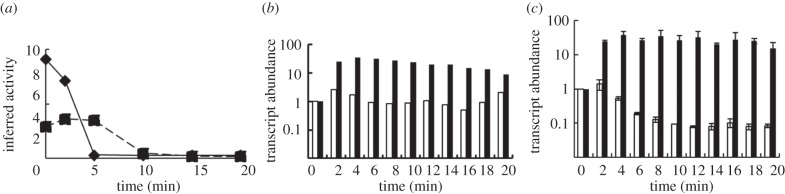
Understanding gene regulation requires knowledge of changes in transcription factor (TF) activities. Simultaneous direct measurement of numerous TF activities is currently impossible. Nevertheless, statistical approaches to infer TF activities have yielded non-trivial and verifiable predictions for individual TFs. Here, global statistical modelling identifies changes in TF activities from transcript profiles of Escherichia coli growing in stable (fixed oxygen availabilities) and dynamic (changing oxygen availability) environments. A core oxygen-responsive TF network, supplemented by additional TFs acting under specific conditions, was identified. The activities of the cytoplasmic oxygen-responsive TF, FNR, and the membrane-bound terminal oxidases implied that, even on the scale of the bacterial cell, spatial effects significantly influence oxygen-sensing. Several transcripts exhibited asymmetrical patterns of abundance in aerobic to anaerobic and anaerobic to aerobic transitions. One of these transcripts, ndh, encodes a major component of the aerobic respiratory chain and is regulated by oxygen-responsive TFs ArcA and FNR. Kinetic modelling indicated that ArcA and FNR behaviour could not explain the ndh transcript profile, leading to the identification of another TF, PdhR, as the source of the asymmetry. Thus, this approach illustrates how systematic examination of regulatory responses in stable and dynamic environments yields new mechanistic insights into adaptive processes.

Keywords: Escherichia coli; mathematical modelling; oxygen-sensing; systems biology; transcript profiling.


Figures

Figure 1.
Figure 1.
Activity profiles for global TFs predicted from gene expression datasets. (a) Inferred activities of the indicated global TFs in stable steady-state cultures grown at defined points on the aerobiosis scale. (b) Inferred activities of the global TFs in the unstable environments of transitions from anaerobic to aerobic conditions (diamonds, solid lines) and aerobic to anaerobic conditions (squares, dashed lines). The inferred activities arise from the term cm(t) in the TFInfer model [11]. In all cases, the signal-to-noise ratio was more than 5.
Figure 2.
Figure 2.
FNR activity under steady-state conditions. (a) The relative activity of FNR estimated from measurement of β-galactosidase activities from the model FNR-dependent FF-41.5 promoter fused to lacZ (data shown in table 1) in cultures grown at the indicated aerobiosis values (white bars). The black bars show the relative activity of FNR inferred from the transcript profiles at the indicated aerobiosis values (as shown in figure 1). In both cases, 1 represents the maximum activity. In the validation experiments (white bars), the chemostats set to achieve 56 per cent aerobiosis actually reached 42 per cent aerobiosis; thus only a single white bar is shown for 42 per cent aerobiosis and a single black bar for 56 per cent aerobiosis. (b) Model illustrating how oxygen consumption at the bacterial cell membrane is sufficient at aerobiosis unit (AU) values less than or equal to 85 per cent to exclude oxygen from the bulk of the cytoplasm. In the absence of oxygen (0% AU), the aerobic electron transport chain is inactive. ArcB autokinase activity is enhanced by: (i) the absence of inhibition by oxidized quinone (Q) [28]; and (ii) fermentation product (d-lactate, acetate, pyruvate) mediated activation of kinase activity and inhibition of ArcA∼P dephosphosphorylation [29,30]. The direct oxygen sensor FNR activates ‘anaerobic’ gene expression in the absence of oxygen [31,32]. Progress up the aerobiosis scale in the greater than 0–85 per cent AU range enhances flux through the aerobic electron transport chain (fed by the major primary dehydrogenases, Nuo and Ndh, and terminating in the major oxidases, Cyd and Cyo) such that oxidized Q is available to inhibit ArcB autokinase activity and the concentrations of fermentation products are lowered, resulting in conversion of ArcA∼P to inactive ArcA. However, FNR remains active, because the abundances of the terminal oxidases [4] are such that oxygen consumption at the membrane protects the cytoplasmic FNR iron–sulphur cluster from oxygen attack (dashed line). Thus, in this ‘micro-aerobic’ range, ArcA-activated genes are switched off but FNR-activated genes remain on. At aerobiosis values greater than or equal to 85 per cent (greater than 85% AU), ArcA is inactivated (dashed line) but the supply of oxygen now exceeds the rate of consumption at the membrane (table 1), exposing FNR to oxygen, thereby switching off FNR-activated genes. Thus, locating sensors in the membrane (ArcB) and the cytoplasm (FNR) allows optimal coordination of gene expression in the ‘micro-aerobic’ range. The model illustrates the data analysis provided in table 1.
Figure 3.
Figure 3.
The oxygen-responsive TF network of E. coli K-12. The three ovals represent the steady-state cultures, the anaerobic–aerobic transition and the aerobic–anaerobic transition. TFs that are predicted to respond are indicated. Sectors that overlap contain TFs that respond in two or all three of the conditions tested.
Figure 4.
Figure 4.
Profiles of transcripts encoding alternative NADH dehydrogenases during adaptation to changes in oxygen availability. (a) Diagram showing the components of the best characterized branched aerobic electron transport chain of E. coli. The central rectangle represents the cytoplasmic membrane. NADH is oxidized by either the proton-translocating NADH dehydrogenase I (Ndh-I, solid line) or by the non-proton-translocating NADH dehydrogenase II (Ndh-II, broken line). Electrons are fed into the quinone pool (Q) and then used by the terminal oxidases (cytochrome bd, Cyt bd-I; or cytochrome bo′, Cyt bo′) in the reduction of oxygen to water. Cyt bo′ has a relatively low affinity for oxygen, whereas Cyt bd-I has a higher affinity for oxygen. Because of the different properties of the dehydrogenases and the oxidases, between one and four protons can be translocated for each electron. (b,c) Transcript profiles of (b) nuoA-N and (c) ndh, during aerobic–anaerobic (white bars) and anaerobic–aerobic (black bars) transitions. Time zero is the aerobic steady state (white bars) or the anaerobic steady state (black bars). The infinity symbol represents the final steady state (anaerobic for the white bars and aerobic for the black bars).
Figure 5.
Figure 5.
ArcA and FNR activities during transitions between aerobic and anaerobic conditions, and repression of ndh transcription by ArcA in vitro. (a) Predicted activities of ArcA (solid lines) during transition from aerobic to anaerobic (i) and anaerobic to aerobic (ii) conditions. The ordinate axes are the ArcA activities (0–1, where 0 is off and 1 is on) estimated from a model based on a two-state Markov jump process in which the TF activity moves quickly between on and off states. To validate the model, the phosphorylation state of ArcA in the bacterial cells at the indicated times was determined by quantitative densitometry of Western blots (representatives shown below the charts) of ArcA separated by Phos-tag-acrylamide gel electrophoresis [4] 0, 1, 2, 5, 10, 15 and 20 min into the transitions (lanes 1–7). Lane 8 shows purified unphosphorylated His-tagged ArcA, and lane 9 shows the phosphorylated form (ArcA∼P) [4]. For each transition, the maximum amount of ArcA∼P measured was set at 1 so that relative ArcA activity could be calculated (diamond data points on the charts) for comparison with the model. (b) Predicted activities of FNR (solid lines) during transition from aerobic to anaerobic (i) and anaerobic to aerobic (ii) conditions. The ordinate axes are the FNR activities (0–1, where 0 is off and 1 is on). To validate the model, the activity of FNR was estimated by measuring transcription from a single-copy synthetic FNR-dependent promoter by RT-PCR (dashed lines). (c) In vitro transcription of ndh in the absence and presence of ArcA. Lanes 1–6, 0, 0.8, 1.3, 1.9, 2.5, 5.0 µM ArcA∼P; lane 7, 5.0 µM dephosphorylated ArcA. The locations of the ndh transcript and the loading control are indicated.
Figure 6.
Figure 6.
The PdhR response accounts for the asymmetrical behaviour of the ndh transcript in transitions. (a) The inferred activity of PdhR during anaerobic–aerobic (diamonds, solid line) and aerobic–anaerobic (squares, dashed line) transitions. High-resolution RT-PCR data for the ndh transcript: (b) wild-type E. coli K-12; (c) pdhR mutant, during aerobic–anaerobic (white bars) and anaerobic–aerobic (black bars) transitions.

References

    1. Guest JR, Green J, Irvine AS, Spiro S. 1996. The FNR modulon and FNR-regulated gene expression. In Regulation of gene expression in Escherichia coli (eds Lin ECC, Lynch AS.), pp. 317–342 Austin, TX: R. G. Landes, Co
    1. Gennis RB, Stewart V. 1996. Respiration. In Escherichia coli and Salmonella cellular and molecular biology (ed. Neidhardt FC.), pp. 217–261, 2nd edn Washington, DC: ASM Press
    1. Bock A, Sawers G. 1996. Fermentation. In Escherichia coli and Salmonella cellular and molecular biology (ed. Neidhardt FC.), pp. 262–282, 2nd edn Washington, DC: ASM Press
    1. Rolfe MD, Ter Beek A, Graham AI, Trotter EW, Asif HMS, Sanguinetti G, Teixeeira de Mattos J, Poole RK, Green J. 2011. Transcript profiling and inference of Escherichia coli K-12 ArcA activity across the range of physiologically relevant oxygen concentrations. J. Biol. Chem. 286, 10 147–10 15410.1074/jbcM110211144 (doi:10.1074/jbcM110211144) - DOI - DOI - PMC - PubMed
    1. Partridge JD, Scott C, Tang Y, Poole RK, Green J. 2006. Escherichia coli transcriptome dynamics during transition from anaerobic to aerobic conditions. J. Biol. Chem. 281, 27 806–27 81510.107/jbcM603450200 (doi:10.107/jbcM603450200) - DOI - DOI - PubMed

Publication types

MeSH terms

LinkOut - more resources