. 2012 Aug 7:12:621.
doi: 10.1186/1471-2458-12-621.

Impact of community tracer teams on treatment outcomes among tuberculosis patients in South Africa

Affiliations

Impact of community tracer teams on treatment outcomes among tuberculosis patients in South Africa

Liza E Bronner et al. BMC Public Health. .

Abstract

Background: Tuberculosis (TB) indicators in South Africa currently remain well below global targets. In 2008, the National Tuberculosis Program (NTP) implemented a community mobilization program in all nine provinces to trace TB patients that had missed a treatment or clinic visit. Implementation sites were selected by TB program managers and teams liaised with health facilities to identify patients for tracing activities. The objective of this analysis was to assess the impact of the TB Tracer Project on treatment outcomes among TB patients.

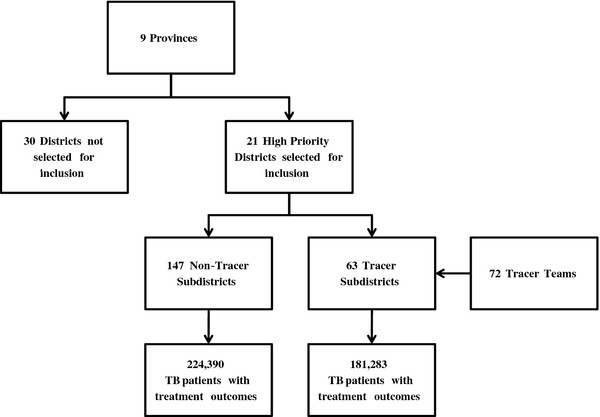
Methods: The study population included all smear positive TB patients registered in the Electronic TB Registry from Quarter 1 2007-Quarter 1 2009 in South Africa. Subdistricts were used as the unit of analysis, with each designated as either tracer (standard TB program plus tracer project) or non-tracer (standard TB program only). Mixed linear regression models were utilized to calculate the percent quarterly change in treatment outcomes and to compare changes in treatment outcomes from Quarter 1 2007 to Quarter 1 2009 between tracer and non-tracer subdistricts.

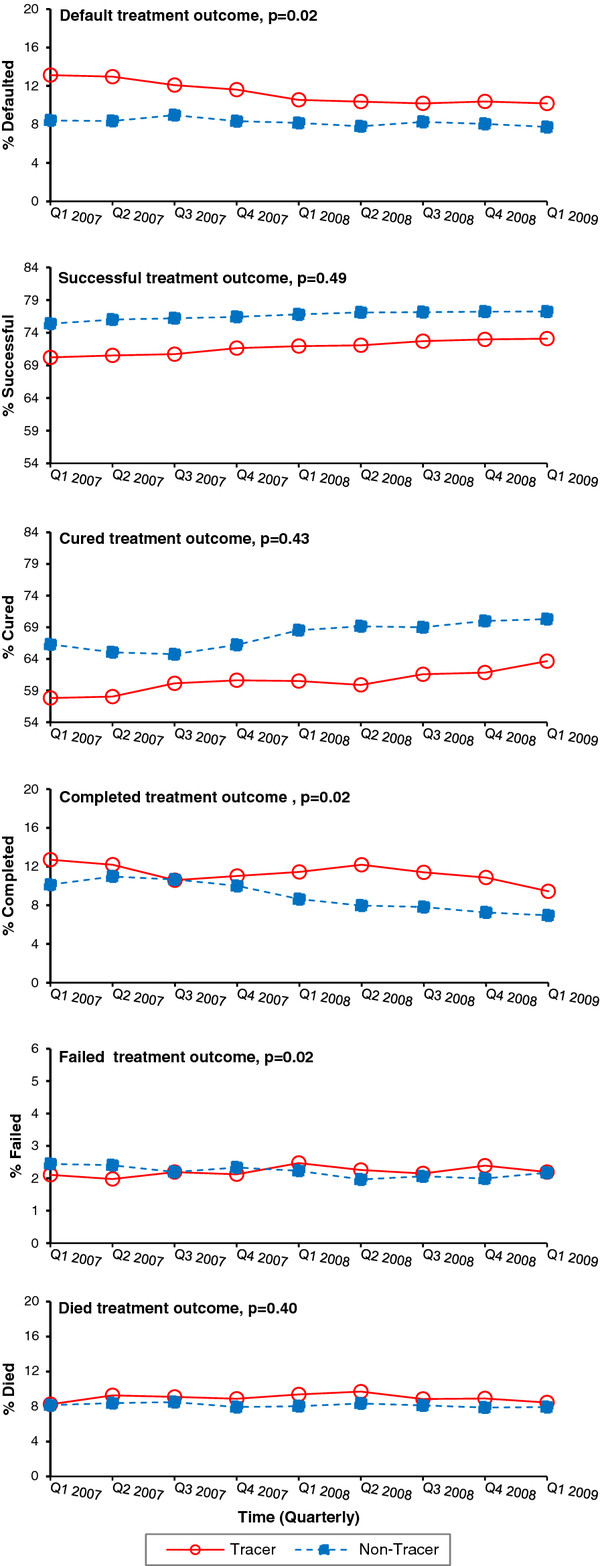
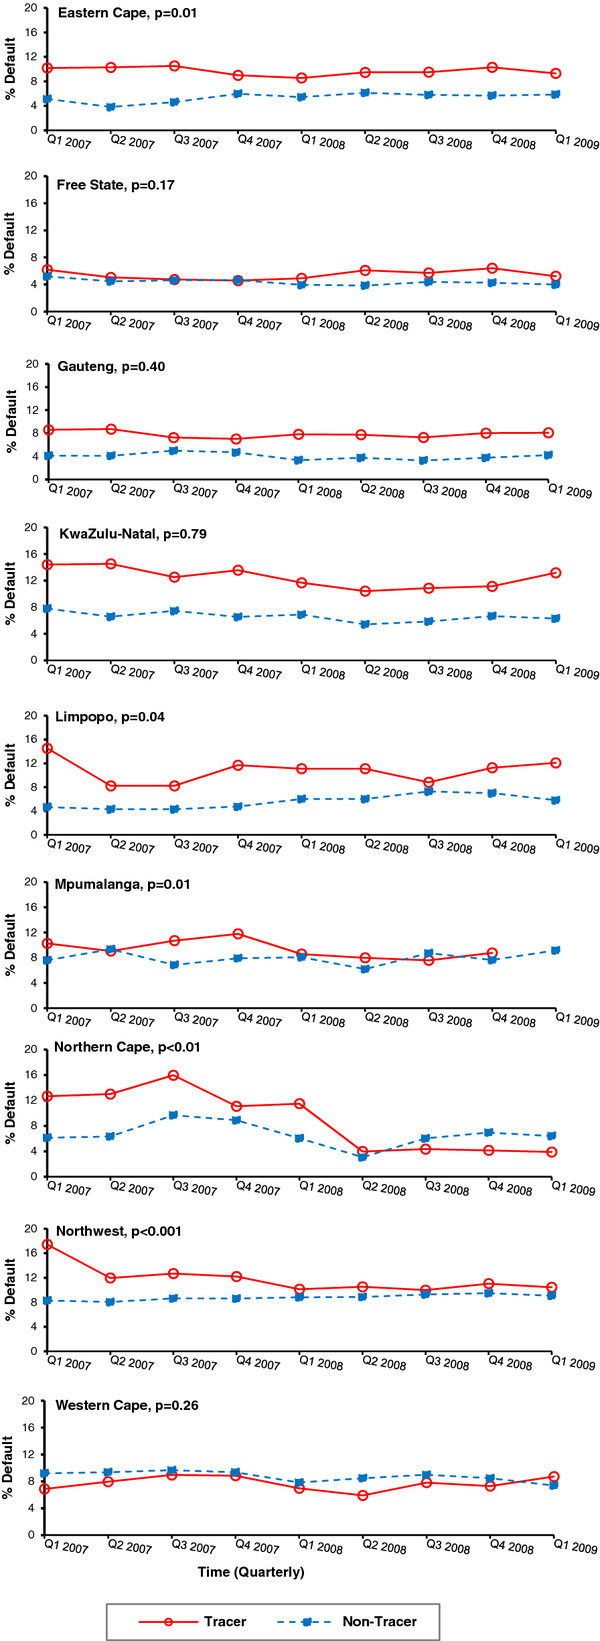
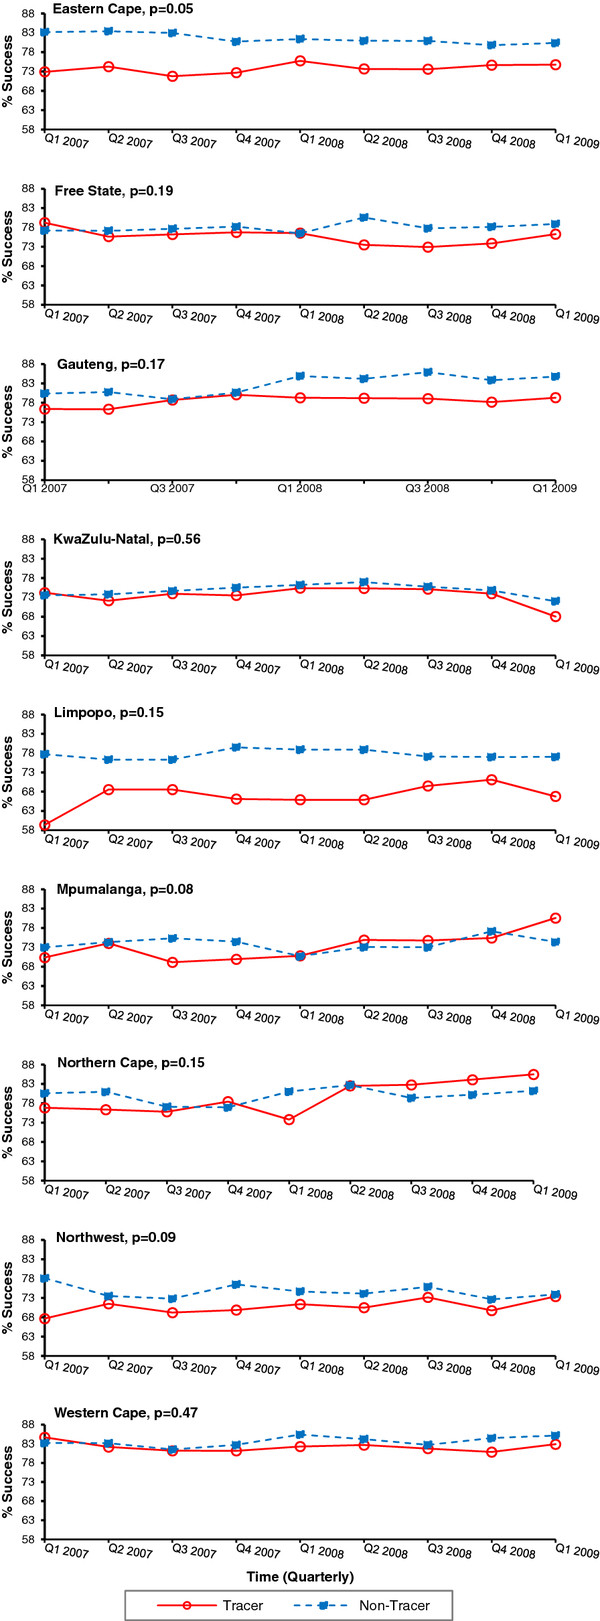
Results: For all provinces combined, the percent quarterly change decreased significantly for default treatment outcomes among tracer subdistricts (-0.031%; p < 0.001) and increased significantly for successful treatment outcomes among tracer subdistricts (0.003%; p = 0.03). A significant decrease in the proportion of patient default was observed for all provinces combined over the time period comparing tracer and non-tracer subdistricts (p = 0.02). Examination in stratified models revealed the results were not consistent across all provinces; significant differences were observed between tracer and non-tracer subdistricts over time in five of nine provinces for treatment default.

Conclusions: Community mobilization of teams to trace TB patients that missed a clinic appointment or treatment dose may be an effective strategy to mitigate default rates and improve treatment outcomes. Additional information is necessary to identify best practices and elucidate discrepancies across provinces; these findings will help guide the NTP in optimizing the adoption of tracing activities for TB control.


Figures

Figure 1
Figure 1
Overview of the TB Tracer Project implementation and study population of TB patients registered in the ETR included for analysis (n = 405,673). The South African National TB Program selected 2 to 4 districts from each of the 9 provinces of South Africa for inclusion in the TB Tracer Project. The selected districts were those with the highest rates of treatment default in 2006. The districts then selected four to six subdistricts to carry out the project with at least one tracer team assigned to each selected subdistrict.
Figure 2
Figure 2
Proportion of all smear positive TB patients with final treatment outcomes for all provinces, tracer vs. non-tracer subdistricts, Quarter 1 2007-Quarter 1 2009, South Africa. A significant difference was detected in tracer subdistricts (solid line) compared to non-tracer subdistricts (dashed line) in the proportion of treatment outcomes for patient default, completion, and failure among all smear positive TB patients with treatment outcomes recorded in the ETR. The p-value reported for each graph represents the significance of the tracer status by time interaction term to assess the change in linear trend of each treatment outcome comparing tracer versus non-tracer subdistricts over time. The y-axis of each graph in Figure 2 varies according to the baseline treatment outcome recorded for Q1 2007. The y-axes were not standardized on a 0-100% scale to allow for better visualization of the percent change in each treatment outcome from baseline to the end of the evaluation period in Q1 2009.
Figure 3
Figure 3
Proportion of all smear positive TB patients with default TB treatment outcomes stratified by province, tracer vs. non-tracer subdistricts, Q1 2007-Q1 2009, South Africa. A significant difference was detected in the proportion of treatment default in 5/9 provinces in South Africa in tracer subdistricts (solid line) compared to non-tracer subdistricts (dashed line). The p-value reported for each graph represents the significance of the tracer status by time interaction term to assess the change in linear trend of each treatment outcome comparing tracer versus non-tracer subdistricts over time. The y-axis representations for percentages of treatment default were not standardized on a 0-100% scale to allow for better visualization of the percent change from Q1 2007 to the end of the evaluation period in Q1 2009.
Figure 4
Figure 4
Proportion of all smear positive TB patients with successful TB treatment outcomes stratified by province, tracer vs. non-tracer subdistricts, Q1 2007-Q1 2009, South Africa. A significant difference was detected in the proportion of treatment success in 1/9 provinces in South Africa in tracer subdistricts (solid line) compared to non-tracer subdistricts (dashed line). The p-value reported for each graph represents the significance of the tracer status by time interaction term to assess the change in linear trend of each treatment outcome comparing tracer versus non-tracer subdistricts over time. The y-axis representations for percentages of treatment success were not standardized on a 0-100% scale to allow for better visualization of the percent change from Q1 2007 to the end of the evaluation period in Q1 2009.

References

    1. World Health Organization. Global tuberculosis control: WHO Report 2010. Geneva Switzerland: WHO; 2010.
    1. Thiam S, LeFevre AM, Hane F, Ndiaye A, Ba F, Fielding KL, Ndir M, Lienhardt C. Effectiveness of a Strategy to Improve Adherence to Tuberculosis Treatment in a Resource-Poor Setting: A Cluster Randomized Controlled Trial. JAMA. 2007;297(4):380–386. doi: 10.1001/jama.297.4.380. - DOI - PubMed
    1. Elbireer S, Guwatudde D, Mudiope P, Nabbuye-Sekandi J, Manabe YC. Tuberculosis treatment default among HIV-TB co-infected patients in urban Uganda. Trop Med Int Health. 2011;16(8):981–987. doi: 10.1111/j.1365-3156.2011.02800.x. - DOI - PubMed
    1. Health SANDo. Draft National Tuberculosis Policy Guidelines 2008. Pretoria, South Africa: National Department of Health of the Republic of South Africa; 2008. The National Tuberculosis Control Programme.
    1. World Health Organization. WHO Report 2008: Global tuberculosis control - epidemiology, strategy, financing. Geneva Switzerland: WHO; 2008.

Publication types

MeSH terms

LinkOut - more resources