. 2012 Oct;31(10):1523-34.
doi: 10.1089/dna.2012.1644. Epub 2012 Aug 7.

Smooth muscle cells isolated from thoracic aortic aneurysms exhibit increased genomic damage, but similar tendency for apoptosis

Affiliations

Smooth muscle cells isolated from thoracic aortic aneurysms exhibit increased genomic damage, but similar tendency for apoptosis

Ceyda Acilan et al. DNA Cell Biol. 2012 Oct.

Abstract

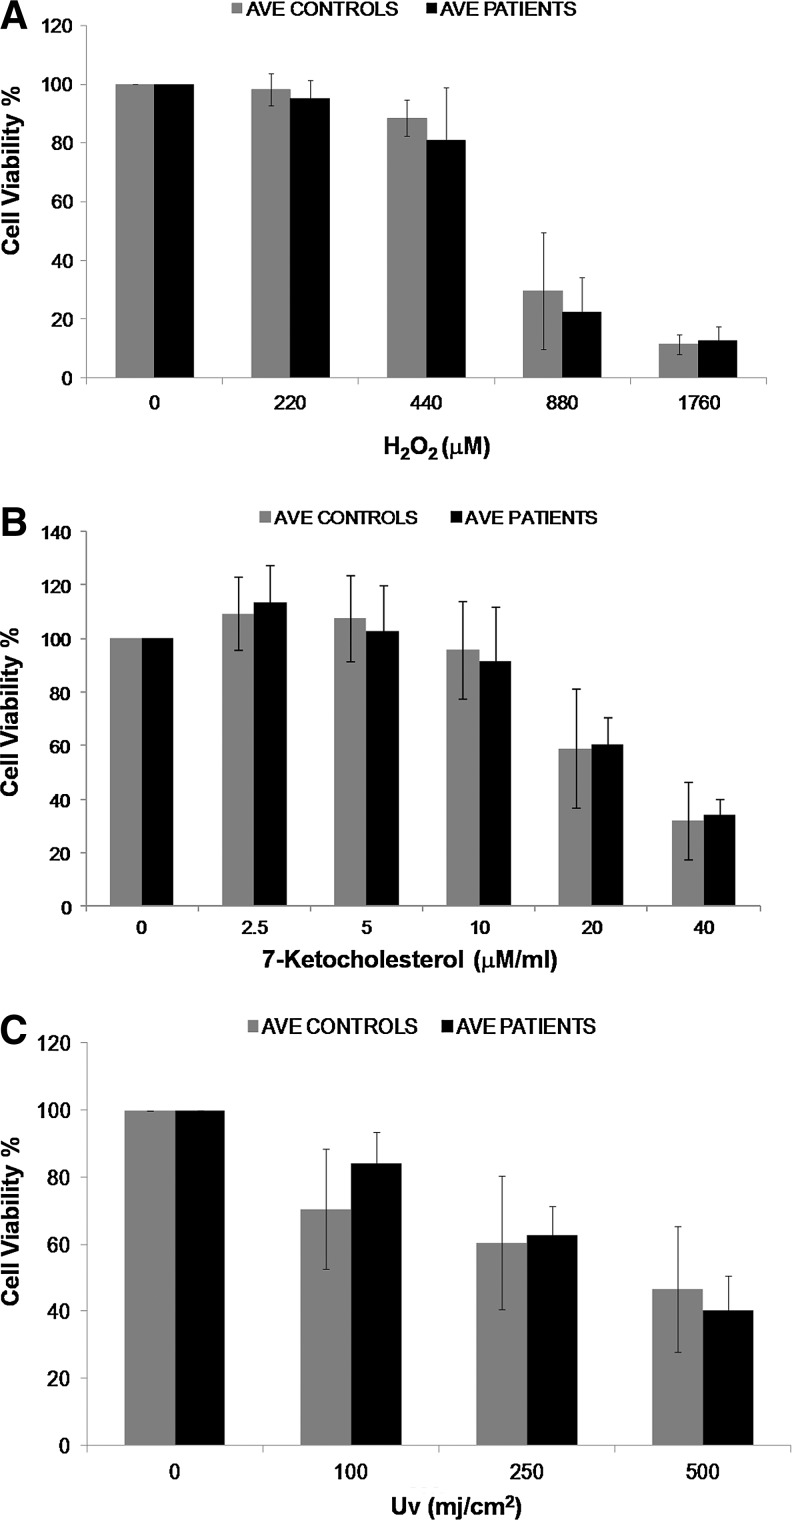
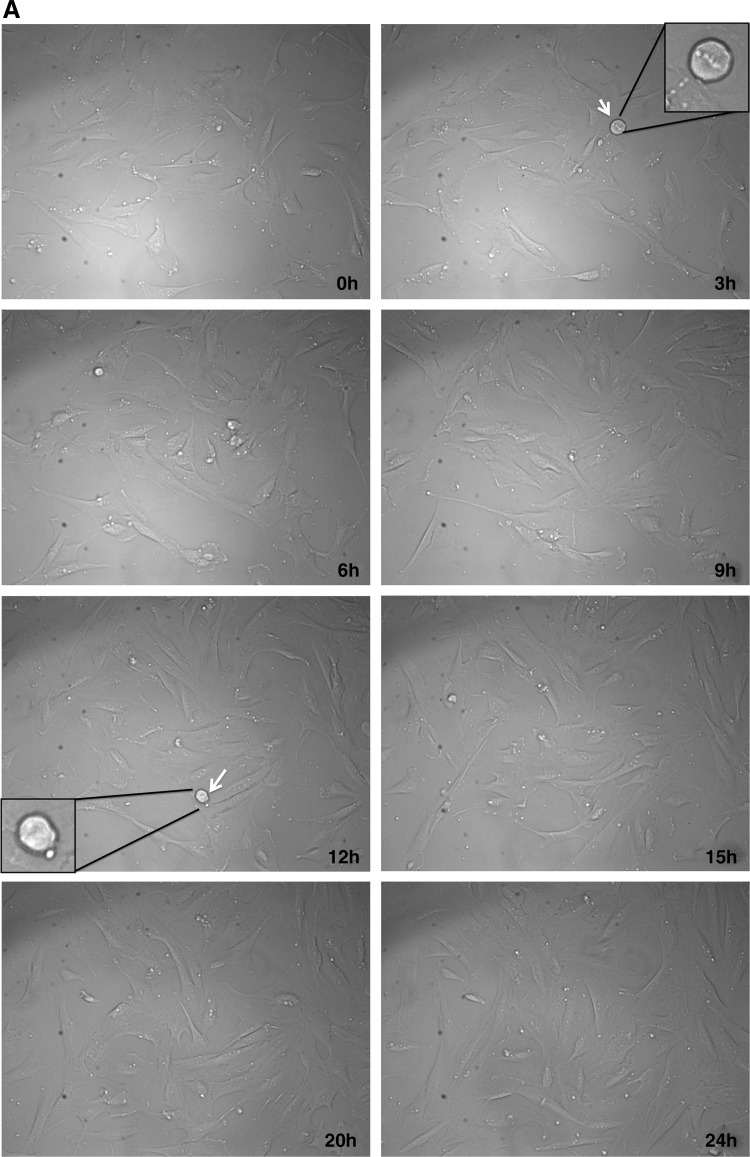
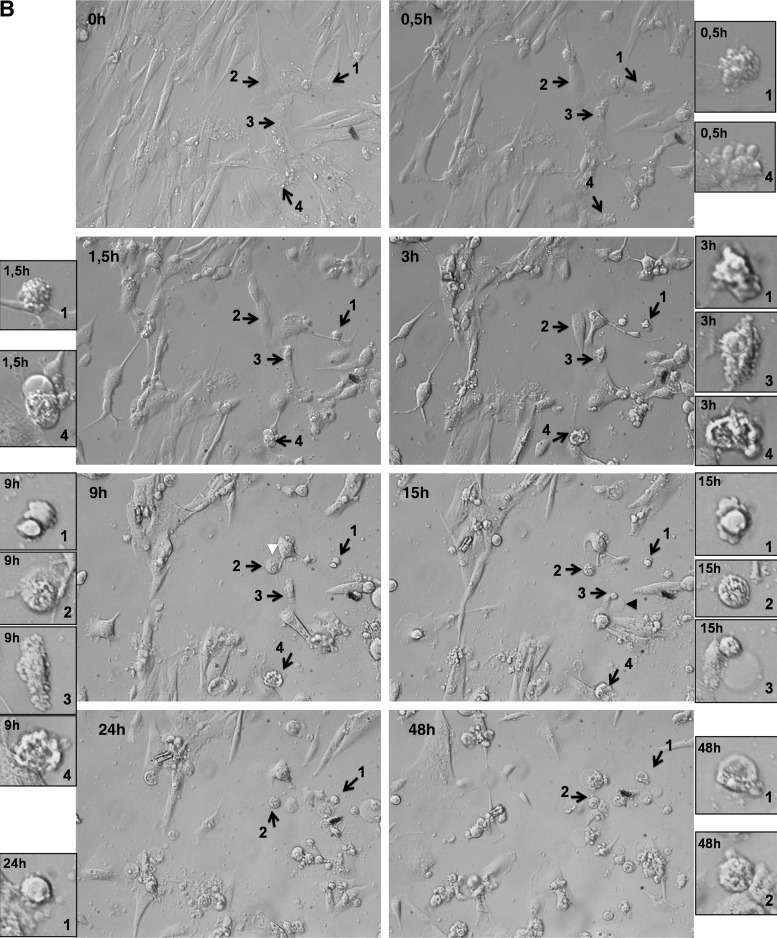
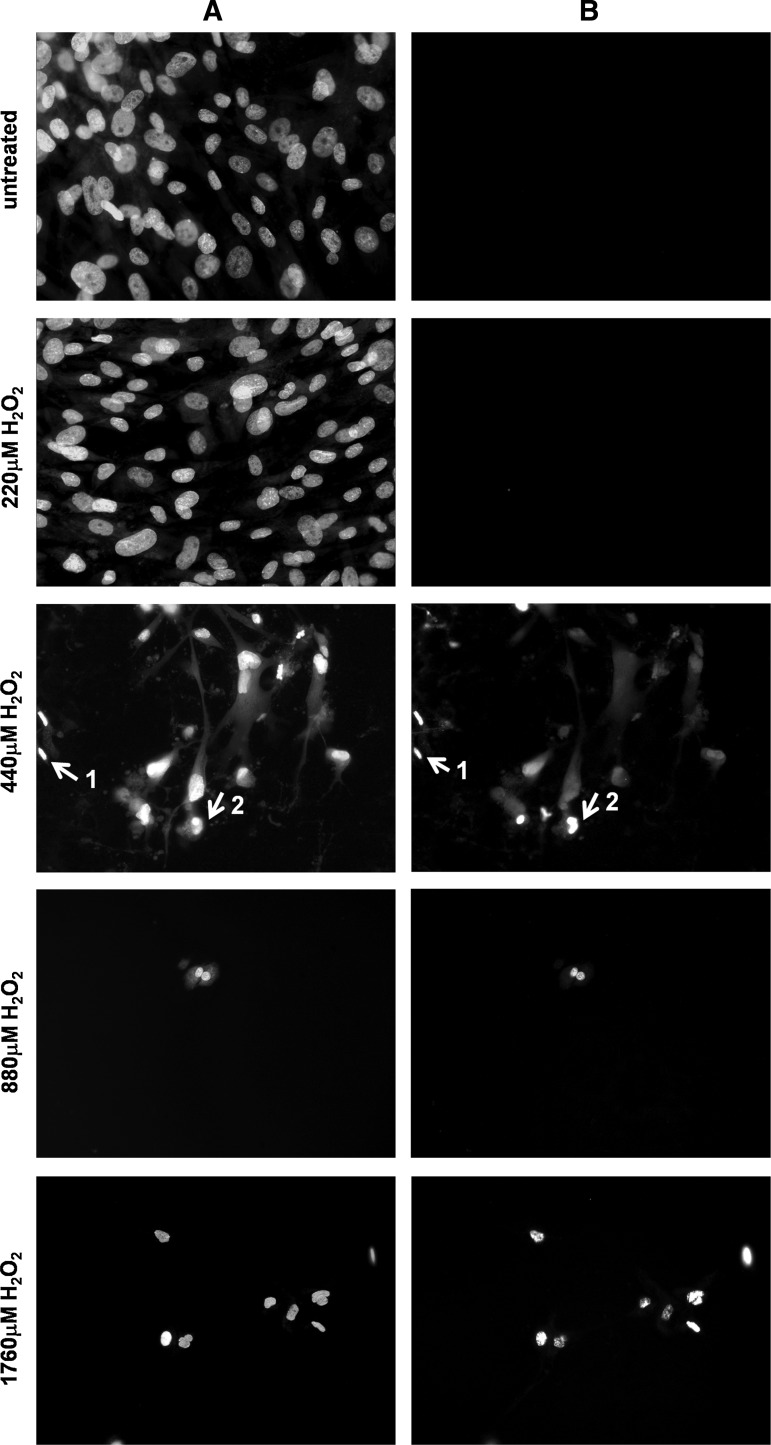
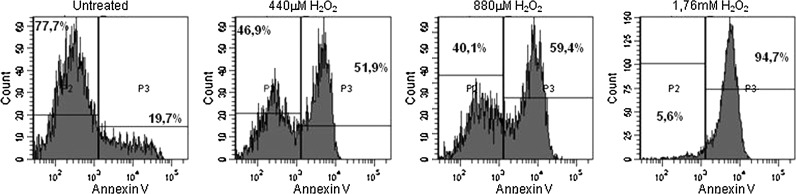
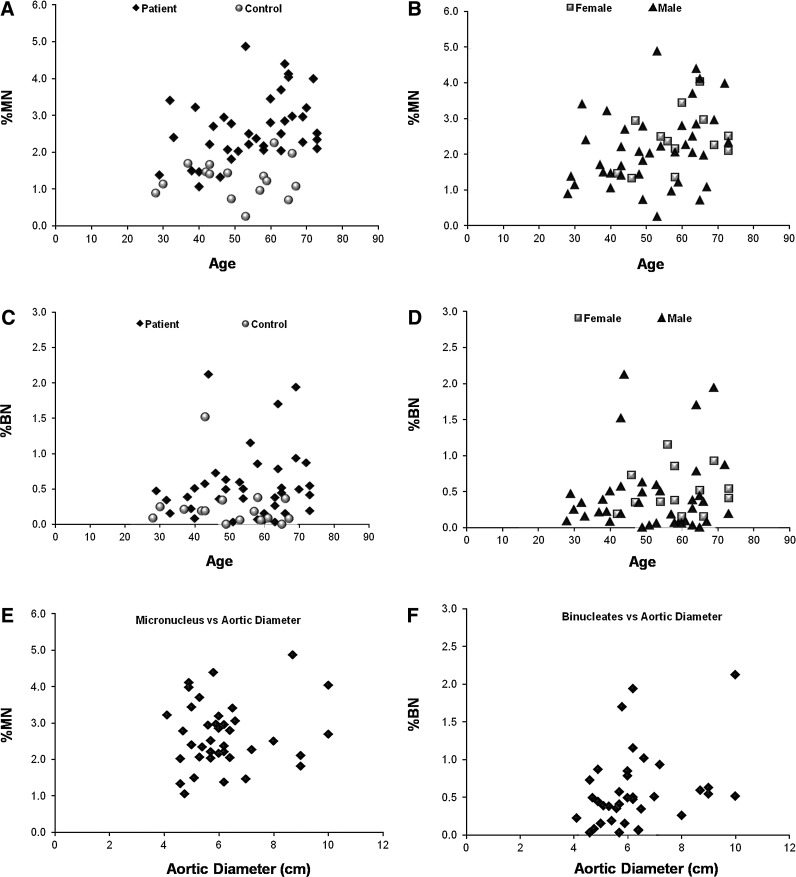
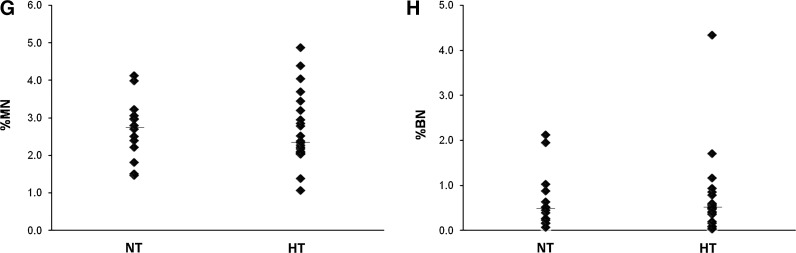
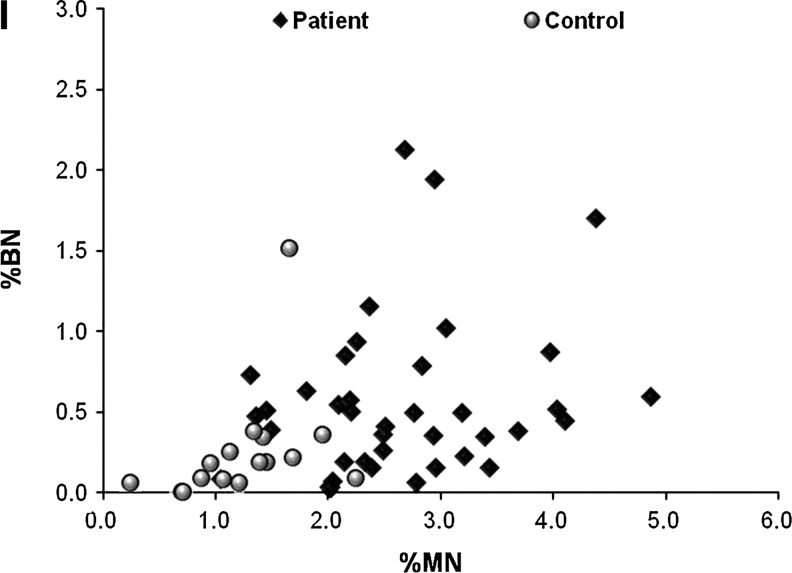
Aortic aneurysms (AA) are characterized by structural deterioration leading to progressive dilation. During the development of AA, two key structural changes are pronounced, one being degradation of extracellular matrix and the other loss of smooth muscle cells (SMCs) through apoptosis. Reactive oxygen species (ROS) are produced above physiological levels in dilated (aneurismal) part of the aorta compared to the nondilated part and they are known to be associated with both the extracellular matrix degradation and the loss of SMCs. In this study, we hypothesized that aneurismal SMCs are more prone to apoptosis and that at least some cells undergo apoptosis due to elevated ROS in the aortic wall. To test this hypothesis, we first isolated SMCs from thoracic aneurismal tissue and compared their apoptotic tendency with normal SMCs in response to H(2)O(2), oxidized sterol, or UV treatment. Exposed cells exhibited morphological changes characteristic of apoptosis, such as cell shrinkage, membrane blebbing, chromatin condensation, and DNA fragmentation. Terminal deoxynucleotidyl transferased UTP nick end labeling (TUNEL) further confirmed the fragmentation of nuclear DNA in these cells. Vascular SMCs were analyzed for their micronuclei (MN) and binucleate (BN) frequency as indicators of genomic abnormality. These data were then compared to patient parameters, including age, gender, hypertension, or aortic diameter for existing correlations. While the tendency for apoptosis was not significantly different compared to normal cells, both the %MN and %BN were higher in aneurismal SMCs. The data suggest that there is increased DNA damage in TAA samples, which might play a pivotal role in disease development.


Figures

FIG. 1.
FIG. 1.
Comparison of cell viability profiles of smooth muscle cells (SMCs) extracted from different individuals in response to H2O2 (A), 7-Ketocholesterol (7-KC) (B), and uv (C) treatment. The graphs show the averages for 13 patients and 7 control SMCs for H2O2, 6 patients and 8 control SMCs for 7-KC, and 6 patients and 5 control SMCs for UV. Each sample was studied in triplicate, with at least three biological repeats. Cell viability curves for individual samples can be seen in Supplementary Figure S3. No significant difference in cell viability in response to oxidative stress was found between patient and control SMCs for all the agents tested.
FIG. 2.
FIG. 2.
Morphological changes as a result of H2O2 treatment in normal SMCs followed by a live‐cell imaging microscope. (A) Untreated cells appeared healthy, evenly spread, and well attached over a period of 24 h. Arrows indicate dividing cells at different time points and the cell number increases by 24 h. Selected cells are enlarged in figure insets. (B) Treatment of H2O2 severely affected cell growth and morphology. Arrows numbered 1, 3, and 4 indicate cells that undergo apoptosis and show typical characteristics, such as detachment of the membrane, cell shrinkage, and blebbing. The cell indicated with the 3rd arrow underwent secondary necrosis after apoptosis and formed a blister (black arrowhead). The cell indicated with the 2nd arrow initially shrunk and probably started apoptosis, but underwent secondary necrosis and formed a blister (white arowhead). Although there are only few examples indicated with the arrows, the images show more cells undergoing apoptosis within the same field. Apoptosis started to occur as early as 0.5h after treatment and took place at different times. There were no cell divisions over a period of 48h. Enlarged views of selected cells can be seen for each time point as indicated. (20× magnification, DIC microscopy, movie at 25 frames/second). Similar results were obtained for both control and aneurismal SMCs.
FIG. 2.
FIG. 2.
Morphological changes as a result of H2O2 treatment in normal SMCs followed by a live‐cell imaging microscope. (A) Untreated cells appeared healthy, evenly spread, and well attached over a period of 24 h. Arrows indicate dividing cells at different time points and the cell number increases by 24 h. Selected cells are enlarged in figure insets. (B) Treatment of H2O2 severely affected cell growth and morphology. Arrows numbered 1, 3, and 4 indicate cells that undergo apoptosis and show typical characteristics, such as detachment of the membrane, cell shrinkage, and blebbing. The cell indicated with the 3rd arrow underwent secondary necrosis after apoptosis and formed a blister (black arrowhead). The cell indicated with the 2nd arrow initially shrunk and probably started apoptosis, but underwent secondary necrosis and formed a blister (white arowhead). Although there are only few examples indicated with the arrows, the images show more cells undergoing apoptosis within the same field. Apoptosis started to occur as early as 0.5h after treatment and took place at different times. There were no cell divisions over a period of 48h. Enlarged views of selected cells can be seen for each time point as indicated. (20× magnification, DIC microscopy, movie at 25 frames/second). Similar results were obtained for both control and aneurismal SMCs.
FIG. 3.
FIG. 3.
Representative images of double-stained terminal deoxynucleotidyl transferase dUTP nick end labeling (TUNEL) positive cells. Cells were treated with increasing doses of H2O2, fixed 9 h after treatment, and stained for (A) DNA (Hoechst dye) and (B) end labeled by TUNEL assay. It was possible to observe both condensed nuclei (arrow 1), and fragmented nuclei (arrow 2) in response to both treatments. The highest dose of exposure (1760 μM H2O2) resulted in shrinkage of nuclei and some condensation, but no fragmentation. Majority of cells were lost during staining procedure and floated away, hence, were not scored for TUNEL positivity.
FIG. 4.
FIG. 4.
H2O2-treated cells exhibit increased Annexin V staining: Cells were treated with H2O2 at indicated doses, stained with Annexin V, and 10000 cells were scored per tube. Percentages in the graph indicate the frequency of Annexin V-positive or -negative cells with the drawn threshold. SMCs from P22 are shown in graph and similar results were obtained for both control and aneurismal SMCs.
FIG. 5.
FIG. 5.
The comparison of criteria under study to patient clinical parameters. %MN (A) and %BN (C) are significantly higher in patient cells compared to their age matched controls, and the difference is not gender specific (B and D). The aortic diameter and blood pressure of control individuals were not measured exactly (yet, were reported to be smaller than 3 cm), hence, the data for controls are missing from (E) to (H). The correlation of the aortic diameter at the time of operation in TAA patients and %MN (E) and %BN (F) in SMCs isolated from these patients are shown in graphs. The bars drawn in (G) and (H) indicate the median value for the distribution of %MN and %BN in normotensive and hypertensive patients. The correlation of %MN and %BN is drawn in (I). (Black diamonds: Patients, Grey circles: Control individuals) MN, micronucleus; BN, binucleate; HT, hypertensive; NT, normotensive.
FIG. 5.
FIG. 5.
The comparison of criteria under study to patient clinical parameters. %MN (A) and %BN (C) are significantly higher in patient cells compared to their age matched controls, and the difference is not gender specific (B and D). The aortic diameter and blood pressure of control individuals were not measured exactly (yet, were reported to be smaller than 3 cm), hence, the data for controls are missing from (E) to (H). The correlation of the aortic diameter at the time of operation in TAA patients and %MN (E) and %BN (F) in SMCs isolated from these patients are shown in graphs. The bars drawn in (G) and (H) indicate the median value for the distribution of %MN and %BN in normotensive and hypertensive patients. The correlation of %MN and %BN is drawn in (I). (Black diamonds: Patients, Grey circles: Control individuals) MN, micronucleus; BN, binucleate; HT, hypertensive; NT, normotensive.

References

    1. Barbour J.R. Spinale F.G. Ikonomidis J.S. Proteinase systems and thoracic aortic aneurysm progression. J Surg Res. 2007;139:292–307. - PubMed
    1. Beckman K.B. Ames B.N. Oxidative decay of DNA. J Biol Chem. 1997;272:19633–19636. - PubMed
    1. Bennett M.R. Evan G.I. Schwartz S.M. Apoptosis of human vascular smooth muscle cells derived from normal vessels and coronary atherosclerotic plaques. J Clin Invest. 1995;95:2266–2274. - PMC - PubMed
    1. Biddinger A. Rocklin M. Coselli J. Milewicz D.M. Familial thoracic aortic dilatations and dissections: a case control study. J Vasc Surg. 1997;25:506–511. - PubMed
    1. Boddy A.M. Lenk G.M. Lillvis J.H. Nischan J. Kyo Y. Kuivaniemi H. Basic research studies to understand aneurysm disease. Drug News Perspect. 2008;21:142–148. - PubMed

Publication types

LinkOut - more resources