Clinical Trial
. 2012 Sep-Oct;133(9-10):581-90.
doi: 10.1016/j.mad.2012.07.005. Epub 2012 Jul 31.

Genotype×age interaction in human transcriptional ageing

Affiliations
Clinical Trial

Genotype×age interaction in human transcriptional ageing

Jack W Kent Jr et al. Mech Ageing Dev. 2012 Sep-Oct.

Abstract

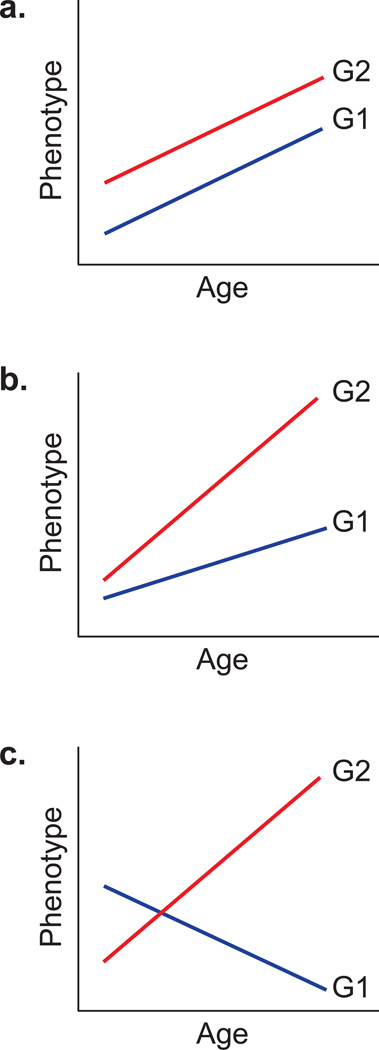
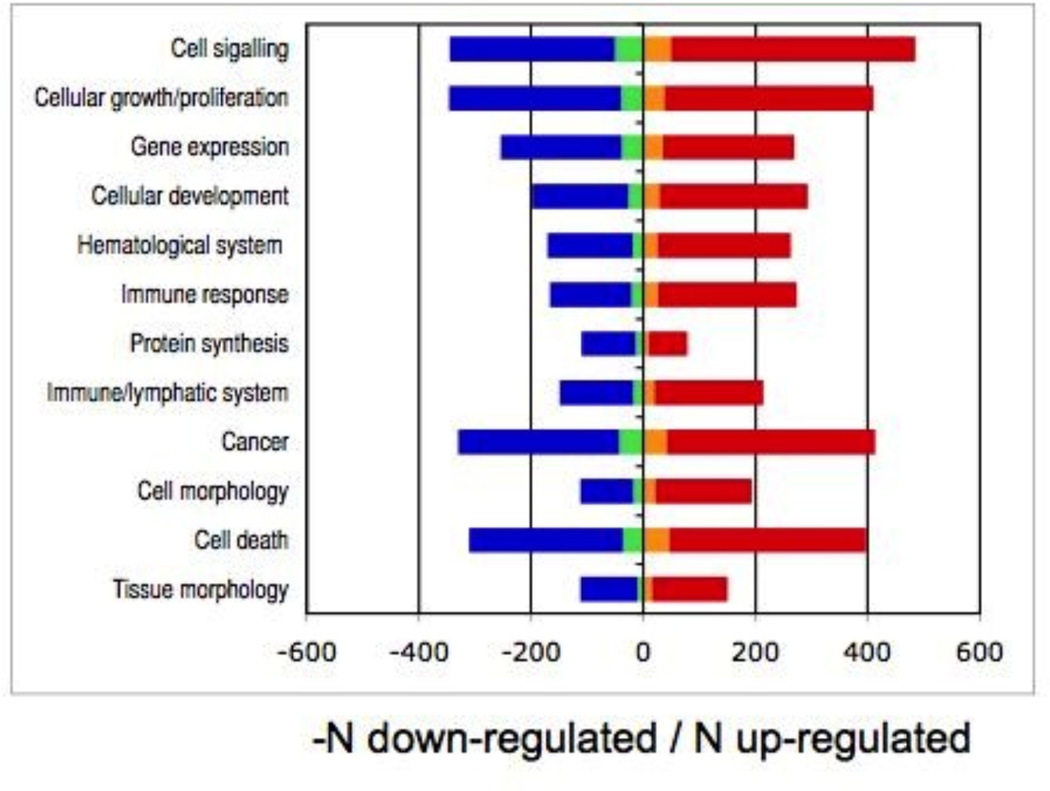
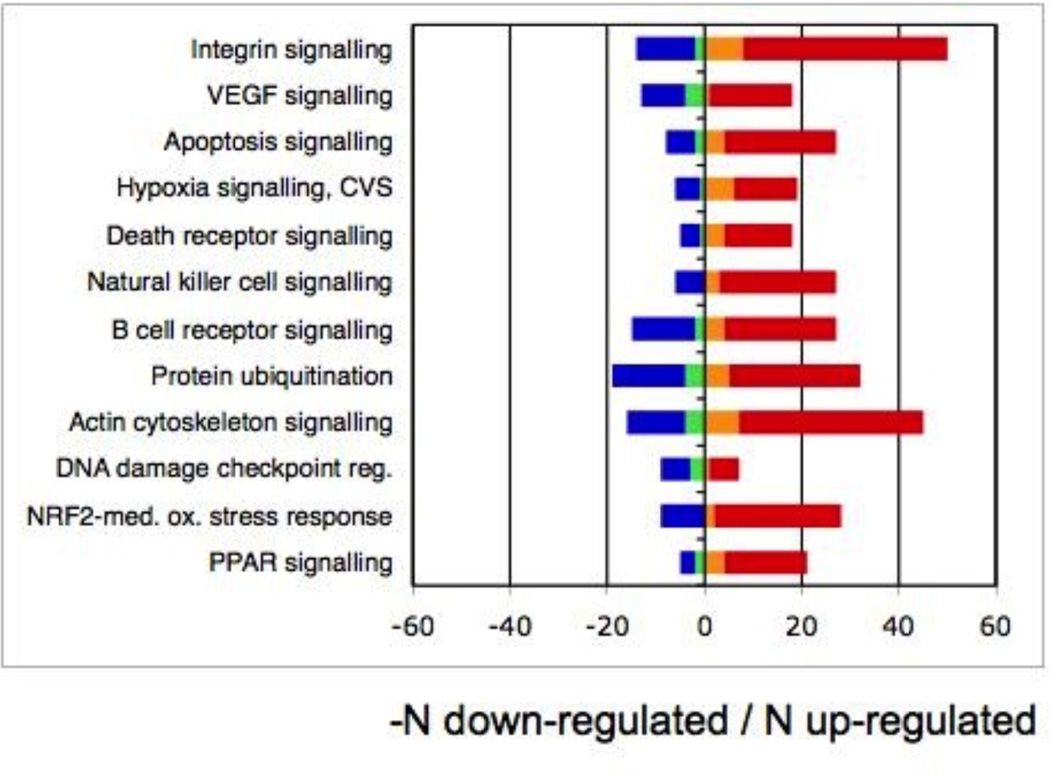
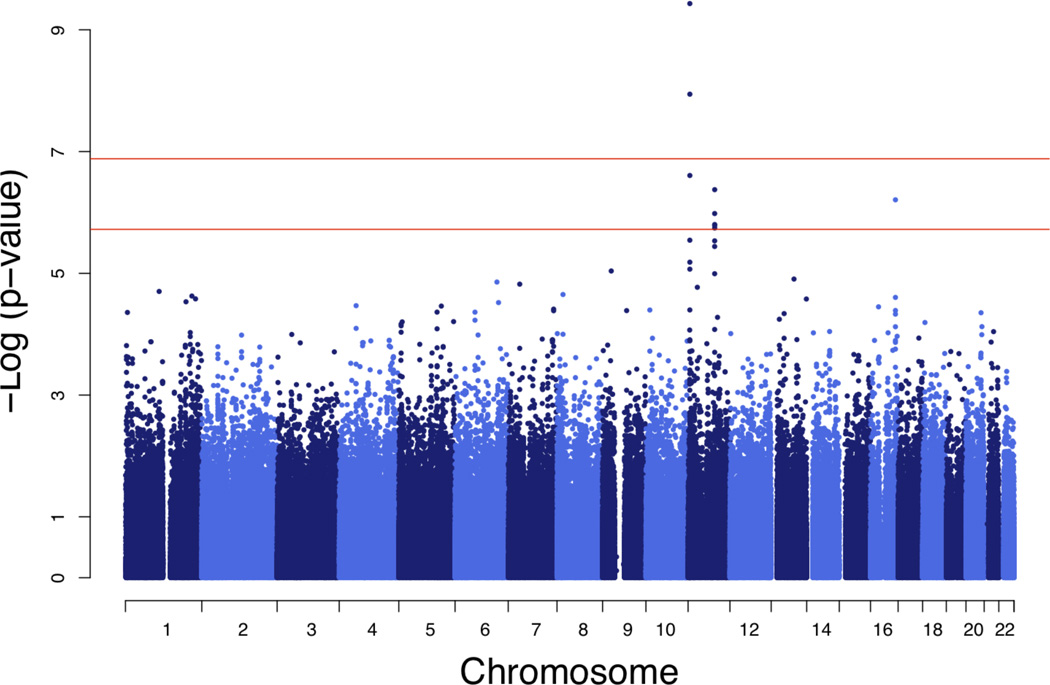
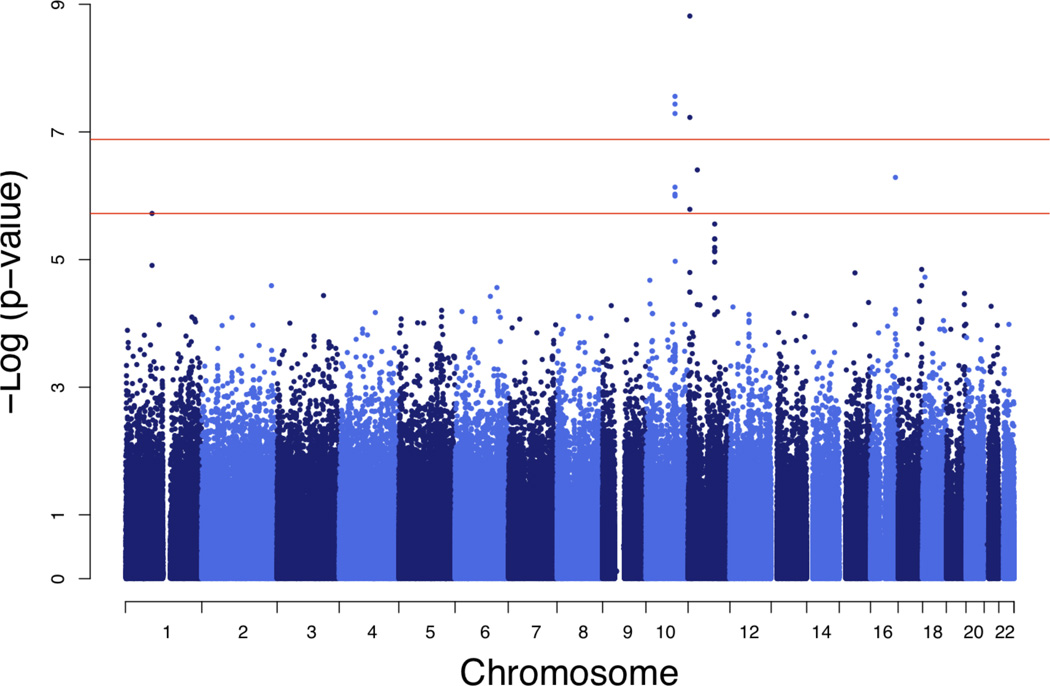
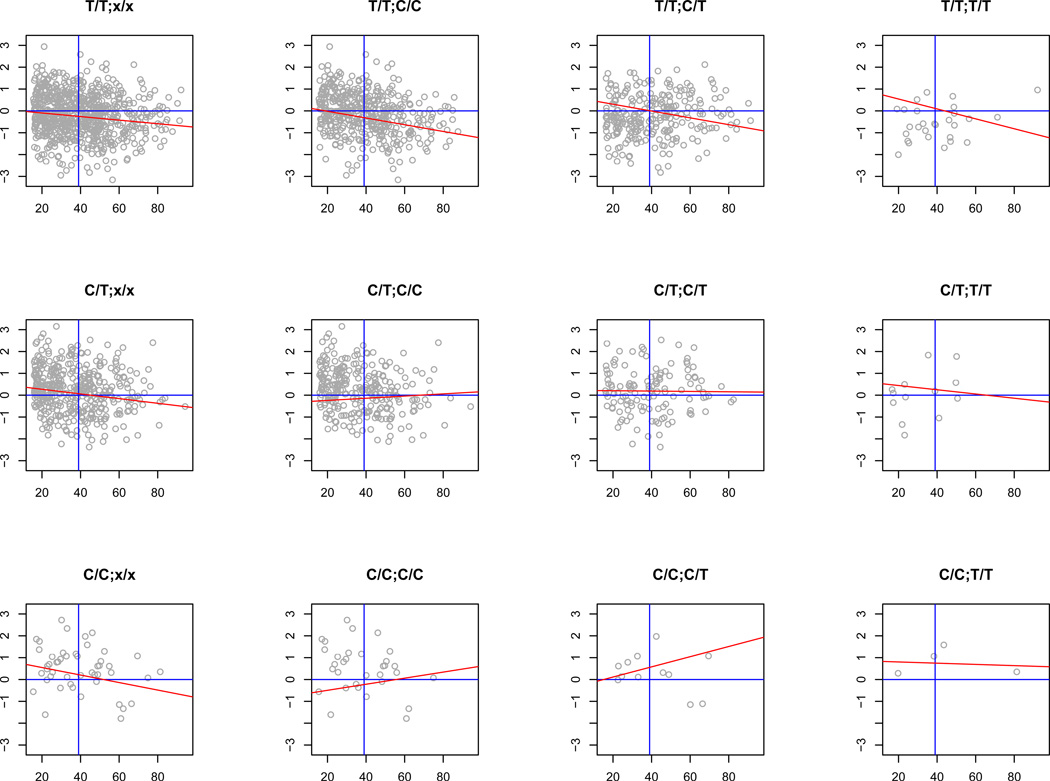
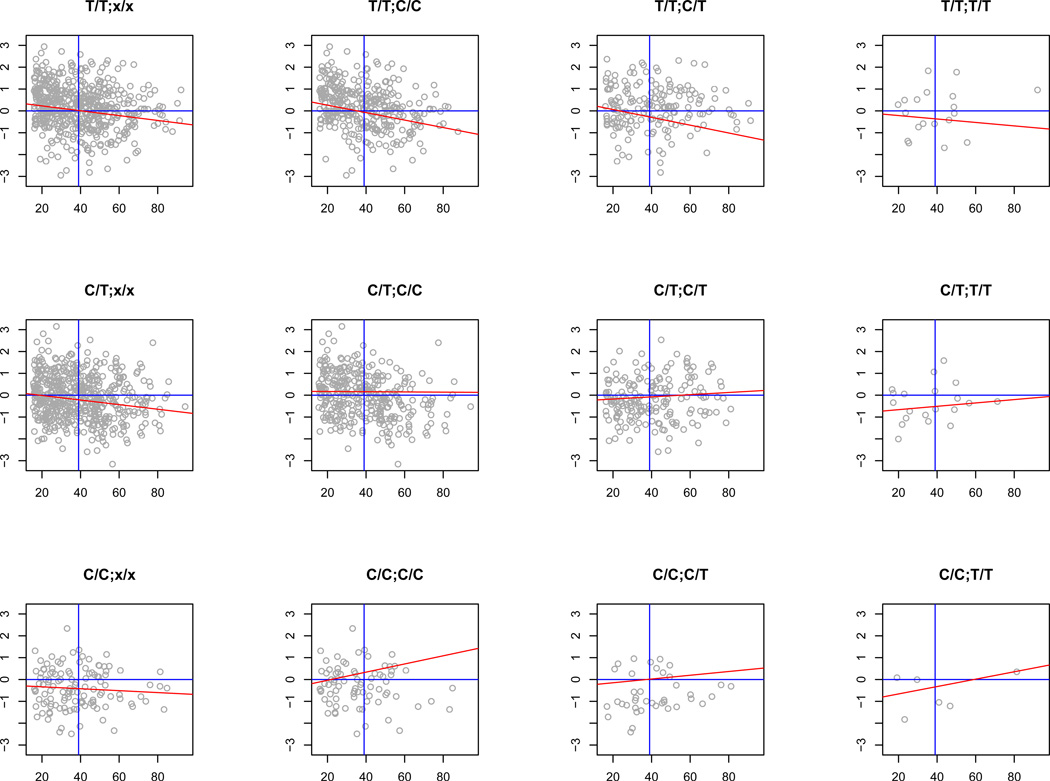
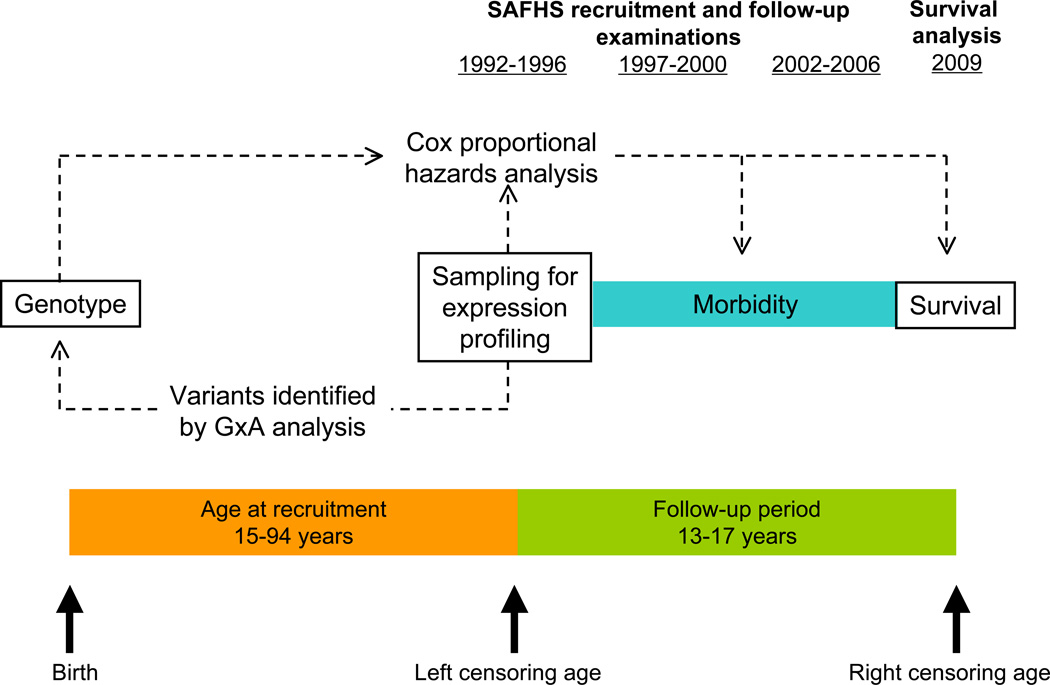
Individual differences in biological ageing (i.e., the rate of physiological response to the passage of time) may be due in part to genotype-specific variation in gene action. However, the sources of heritable variation in human age-related gene expression profiles are largely unknown. We have profiled genome-wide expression in peripheral blood mononuclear cells from 1240 individuals in large families and found 4472 human autosomal transcripts, representing ~4349 genes, significantly correlated with age. We identified 623 transcripts that show genotype by age interaction in addition to a main effect of age, defining a large set of novel candidates for characterization of the mechanisms of differential biological ageing. We applied a novel SNP genotype × age interaction test to one of these candidates, the ubiquilin-like gene UBQLNL, and found evidence of joint cis-association and genotype by age interaction as well as trans-genotype by age interaction for UBQLNL expression. Both UBQLNL expression levels at recruitment and cis genotype are associated with longitudinal cancer risk in our study cohort.


Figures

Figure 1
Figure 1. Hypothetical norms of reaction
mean expression levels of a hypothetical gene for two genotypes G1, G2 measured at different ages (after Bell (1990)). a, no interaction: G2 is more highly expressed at all ages, so genotype responses to age have correlation=+1; trait variance does not change with age. b, variance-type interaction: G2 is always more highly expressed (correlation=+1) but genotype means diverge with age (and consequently variance increases with age). c, correlation-type interaction: responses of G1 and G2 do not have correlation=+1 since ranks of G1, G2 change with age; trait variance does not change monotonically with age.
Figure 2
Figure 2. Functional characterization of age-correlated transcripts
a, top 12 assignments to functional class ranked by decreasing significance (range: P=2.3×10⁻²⁹, P=1.6×10⁻¹²). b, top 12 assignments to canonical pathway (range: P=6.2×10⁻⁹, P=1.1×10⁻⁴). Legend: down-regulated with age, non-G×A: blue; down-regulated G×A: green; up-regulated G×A: orange; up-regulated, non-G×A: red.
Figure 3
Figure 3. Genome-wide plots for SNP association with UBQLNL expression
a, evidence for association with 536,821 haplotype-tagging SNPs (1 df test). b, 2 df test for association contingent on SNP genotype × age interaction. Red horizontal lines represent empirical thresholds for suggestive evidence of association (occurring once per genome scan by chance, P=1.9×10⁻⁶) and genome-wide P=0.05 (P=1.3×10⁻⁷). Empirical thresholds were obtained from 10,000 replicate GWAS of a simulated non-associated trait.
Figure 4
Figure 4. Norms of reaction for cis- and trans-regulatory variants
Genotype-specific regressions of UBQLNL mRNA levels on age. Panel A, cis-SNP = rs7939159; Panel B, cis-SNP = rs7129909; trans-SNP = rs11591635 in each case. Plot labels = cis-/trans genotype. Left column: norms of reaction for cis-acting SNP genotypes without stratification by trans-interacting genotype show an overall reduction of expression level with age (red lines reflect maximum-likelihood estimates of regression slope and intercept at cohort mean age). Remaining columns: cis-genotypes stratified by trans-genotype reveal patterns of cis-trans G×AI (see text). Grey axes represent mean values for UBQLNL expression (vertical axis, horizontal line) and age (horizontal axis, vertical line).
Figure 5
Figure 5. Experimental design of survival analysis
Expression phenotypes were measured in blood samples drawn at recruitment. G×AI analyses were based on cross-sectional data for this time point, using the range of ages at recruitment (15–94ya). Longitudinal disease incidence and mortality data were collected for the cohort over the subsequent ~16y follow-up period. Cox proportional hazards analysis was performed for hazards including the prospective effect of baseline expression levels of UBQLNL and genotype for associated SNPs.

References

    1. Almasy L, Blangero J. Multipoint quantitative-trait linkage analysis in general pedigrees. Am. J. Hum. Genet. 1998;62:1198–1211. - PMC - PubMed
    1. Almasy L, Towne B, Peterson C, Blangero J. Detecting genotype×age interaction. Genet. Epidemiol. 2001;21(suppl. 1):S819–S824. - PubMed
    1. Arking R. The Biology of Aging: Observations and Principles. 3rd ed. New York: Oxford University Press; 2006.
    1. Bell G. The ecology and genetics of fitness inChlamydomonas I. Genotype-by-environment interaction among pure strains. Proc. R. Soc. Lond. B. 1990;240(1298):295–321.
    1. Benjamini Y, Hochberg Y. Controlling the false discovery rate: A practical and powerful approach to multiple testing. J. Royal Stat. Soc. Ser. B. 1995;57(1):289–300.

Publication types

MeSH terms