

Odor-evoked activity in the mouse lateral entorhinal cortex
- PMID: 22871522
- PMCID: PMC3455128
- DOI: 10.1016/j.neuroscience.2012.07.067
Odor-evoked activity in the mouse lateral entorhinal cortex
Abstract
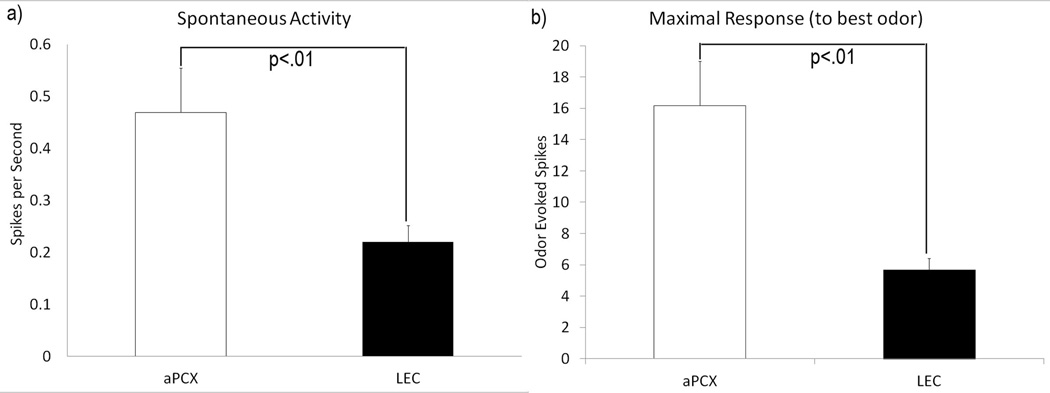
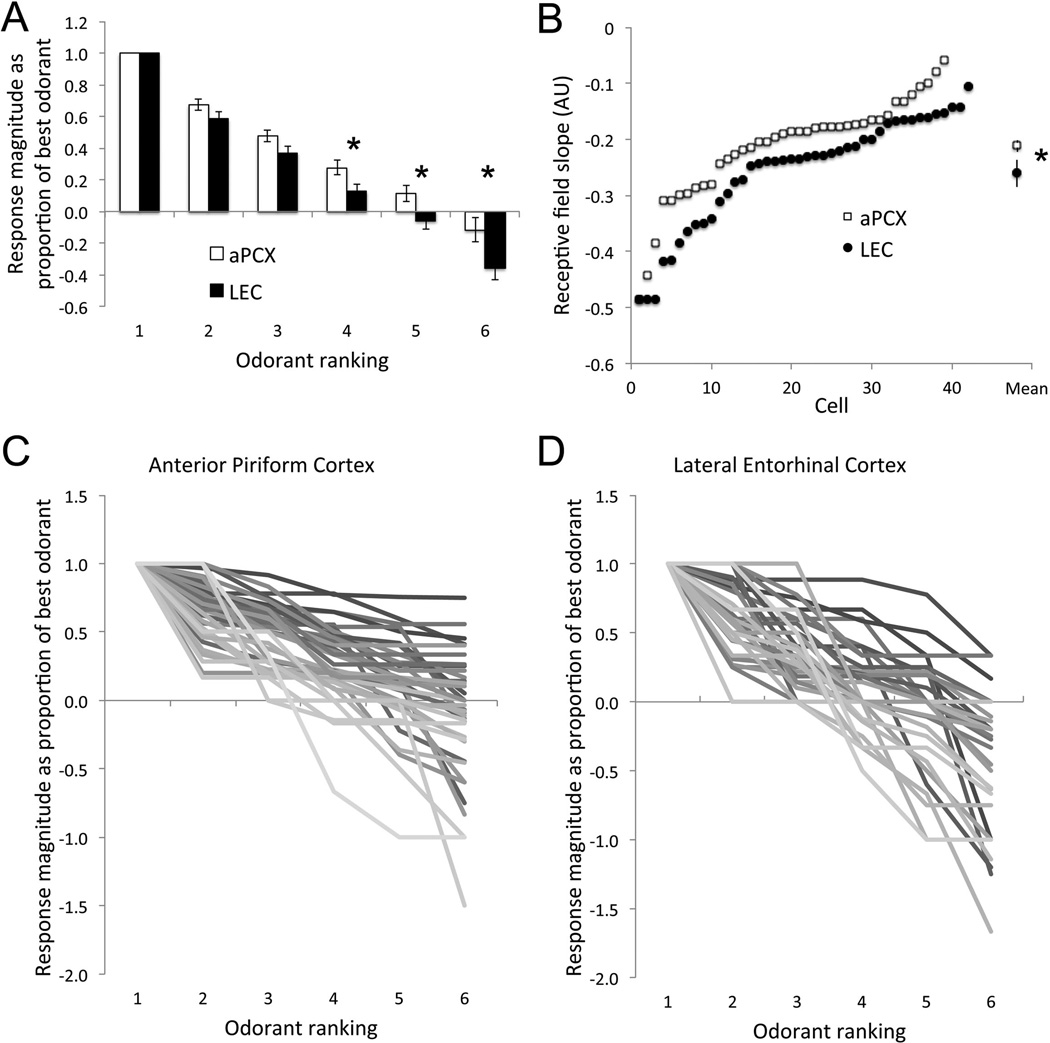
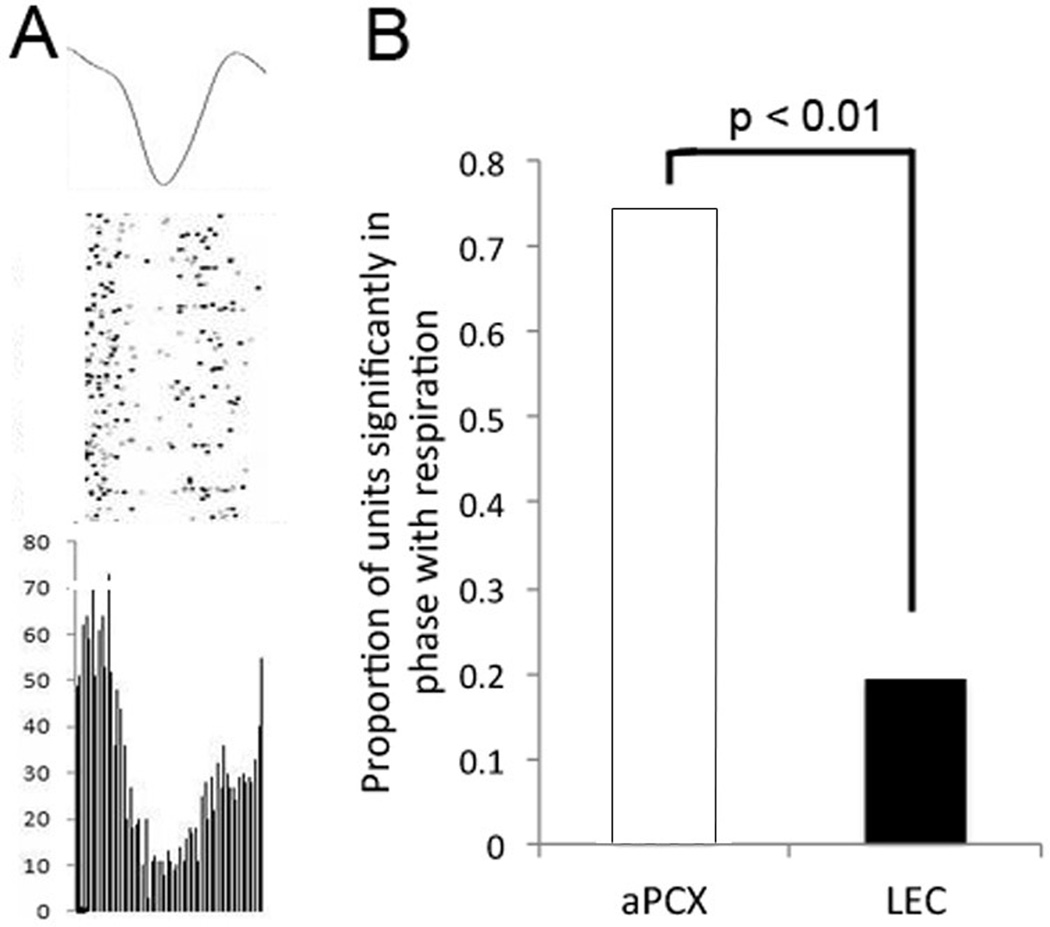
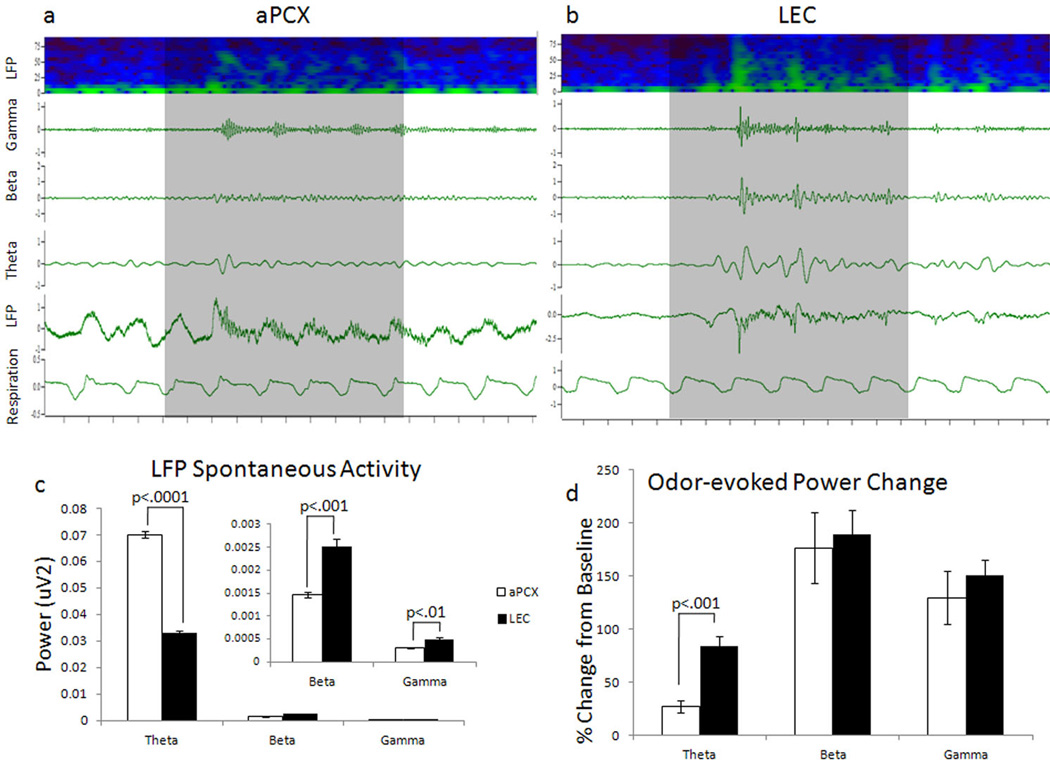
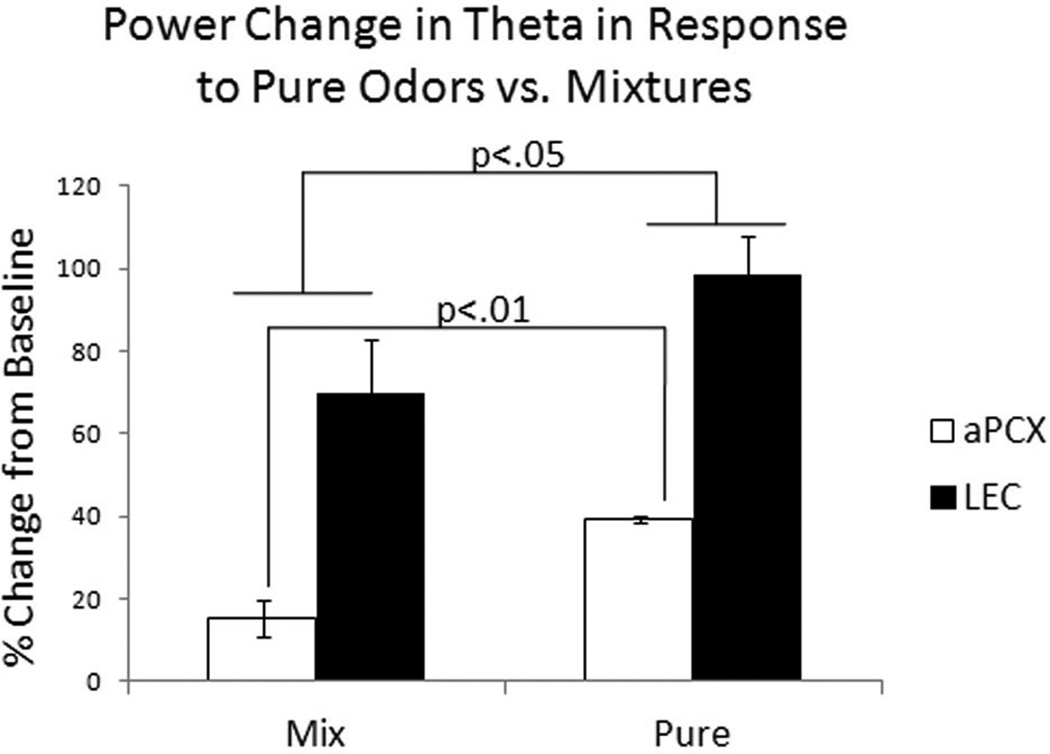
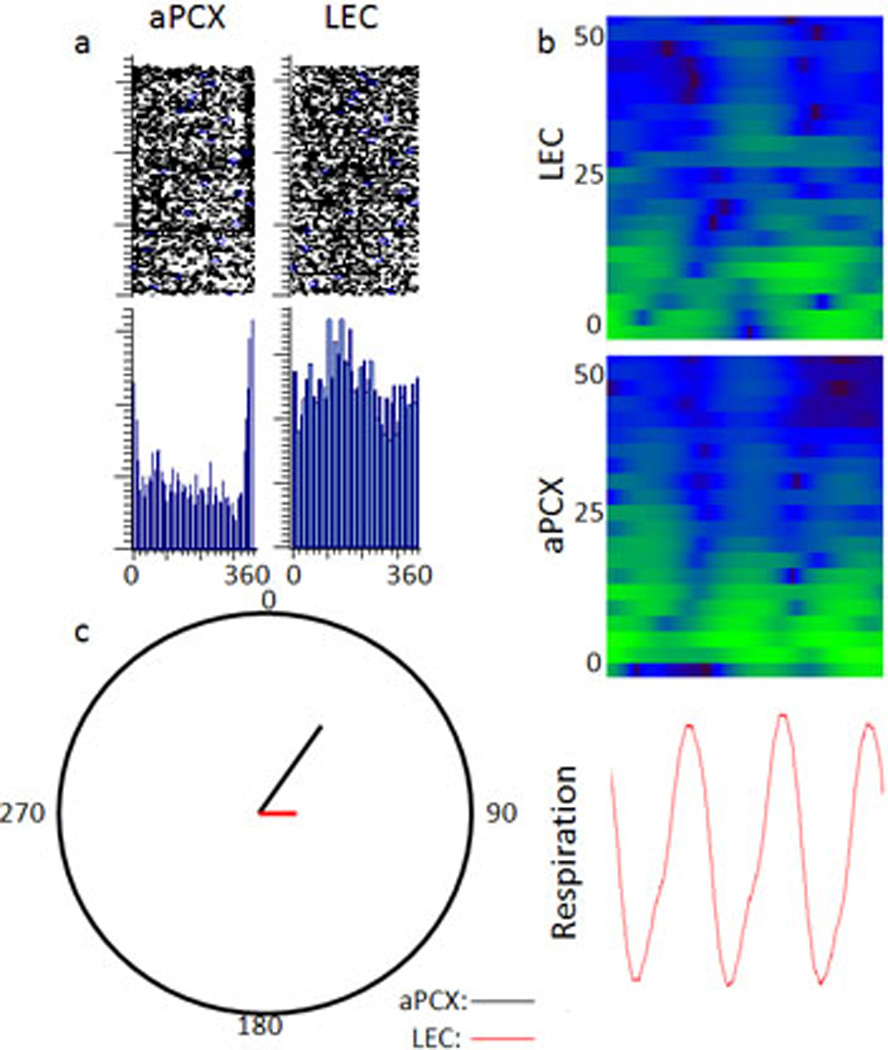
The entorhinal cortex is a brain area with multiple reciprocal connections to the hippocampus, amygdala, perirhinal cortex, olfactory bulb and piriform cortex. As such, it is thought to play a large role in the olfactory memory process. The present study is the first to compare lateral entorhinal and anterior piriform cortex odor-evoked single-unit and local field potential activity in mouse. Recordings were made in urethane-anesthetized mice that were administered a range of three pure odors and three overlapping odor mixtures. Results show that spontaneous as well as odor-evoked unit activity was lower in lateral entorhinal versus piriform cortex. In addition, units in lateral entorhinal cortex were responsive to a more restricted set of odors compared to piriform. Conversely, odor-evoked power change in local field potential activity was greater in the lateral entorhinal cortex in the theta band than in piriform. The highly odor-specific and restricted firing in lateral entorhinal cortex suggests that it may play a role in modulating odor-specific, experience- and state-dependent olfactory coding.
Copyright © 2012 IBRO. Published by Elsevier Ltd. All rights reserved.
Figures
Similar articles
-
Lateral entorhinal modulation of piriform cortical activity and fine odor discrimination.J Neurosci. 2013 Aug 14;33(33):13449-59. doi: 10.1523/JNEUROSCI.1387-13.2013. J Neurosci. 2013. PMID: 23946403 Free PMC article.
-
Optogenetic Stimulation of Lateral Amygdala Input to Posterior Piriform Cortex Modulates Single-Unit and Ensemble Odor Processing.Front Neural Circuits. 2015 Dec 21;9:81. doi: 10.3389/fncir.2015.00081. eCollection 2015. Front Neural Circuits. 2015. PMID: 26733819 Free PMC article.
-
Spatially segregated feedforward and feedback neurons support differential odor processing in the lateral entorhinal cortex.Nat Neurosci. 2016 Jul;19(7):935-44. doi: 10.1038/nn.4303. Epub 2016 May 16. Nat Neurosci. 2016. PMID: 27182817
-
Processing of cell assemblies in the lateral entorhinal cortex.Rev Neurosci. 2022 Apr 22;33(8):829-847. doi: 10.1515/revneuro-2022-0011. Print 2022 Dec 16. Rev Neurosci. 2022. PMID: 35447022 Review.
-
Coding odor identity and odor value in awake rodents.Prog Brain Res. 2014;208:205-22. doi: 10.1016/B978-0-444-63350-7.00008-5. Prog Brain Res. 2014. PMID: 24767484 Free PMC article. Review.
Cited by
-
Stimulation-induced entrainment of hippocampal network activity: Identifying optimal input frequencies.Hippocampus. 2023 Feb;33(2):85-95. doi: 10.1002/hipo.23490. Epub 2023 Jan 9. Hippocampus. 2023. PMID: 36624658 Free PMC article.
-
Coordinated electrical activity in the olfactory bulb gates the oscillatory entrainment of entorhinal networks in neonatal mice.PLoS Biol. 2019 Jan 31;17(1):e2006994. doi: 10.1371/journal.pbio.2006994. eCollection 2019 Jan. PLoS Biol. 2019. PMID: 30703080 Free PMC article.
-
Lateral Entorhinal Cortex Suppresses Drift in Cortical Memory Representations.J Neurosci. 2022 Feb 9;42(6):1104-1118. doi: 10.1523/JNEUROSCI.1439-21.2021. Epub 2021 Dec 15. J Neurosci. 2022. PMID: 34911795 Free PMC article.
-
Spared piriform cortical single-unit odor processing and odor discrimination in the Tg2576 mouse model of Alzheimer's disease.PLoS One. 2014 Sep 2;9(9):e106431. doi: 10.1371/journal.pone.0106431. eCollection 2014. PLoS One. 2014. PMID: 25181487 Free PMC article.
-
Specific contribution of neurons from the Dbx1 lineage to the piriform cortex.Sci Rep. 2021 Apr 16;11(1):8349. doi: 10.1038/s41598-021-86512-8. Sci Rep. 2021. PMID: 33863910 Free PMC article.
References
-
- Baxter MG. Involvement of medial temporal lobe structures in memory and perception. Neuron. 2009;61:667–677. - PubMed
-
- Bernabeu R, Thiriet N, Zwiller J, Di Scala G. Lesion of the lateral entorhinal cortex amplifies odor-induced expression of c-fos, junB, and zif 268 mRNA in rat brain. Synapse. 2006;59:135–143. - PubMed
-
- Boeijinga PH, Lopes da Silva FH. Modulations of EEG activity in the entorhinal cortex and forebrain olfactory areas during odour sampling. Brain Res. 1989;478:257–268. - PubMed
Publication types
MeSH terms
Grants and funding
LinkOut - more resources
Full Text Sources
Research Materials
