Review
. 2012 Nov;31(6):702-19.
doi: 10.1016/j.preteyeres.2012.07.001. Epub 2012 Aug 1.

Critical pathogenic events underlying progression of neurodegeneration in glaucoma

Affiliations
Review

Critical pathogenic events underlying progression of neurodegeneration in glaucoma

David J Calkins. Prog Retin Eye Res. 2012 Nov.

Abstract

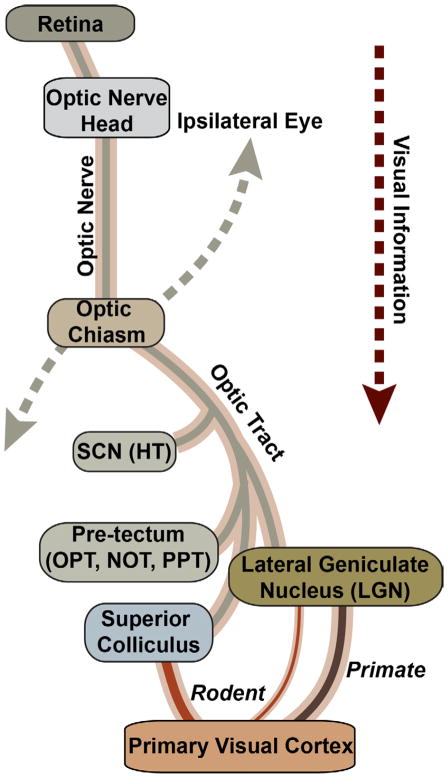
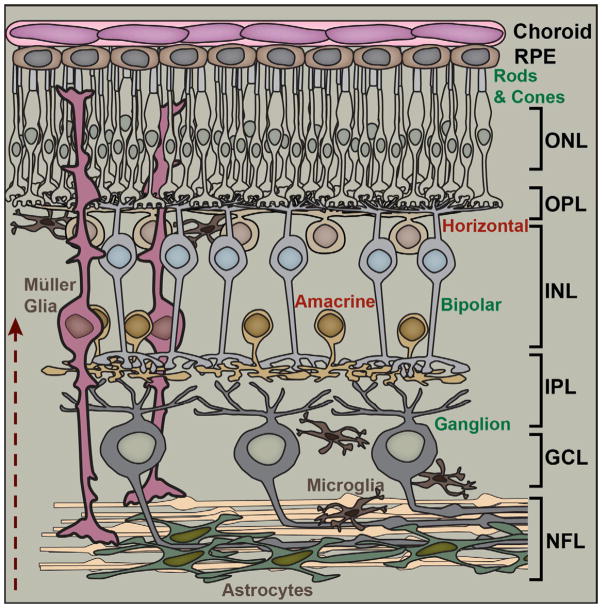
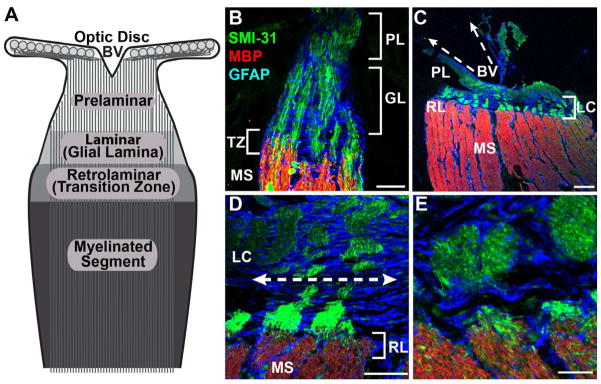
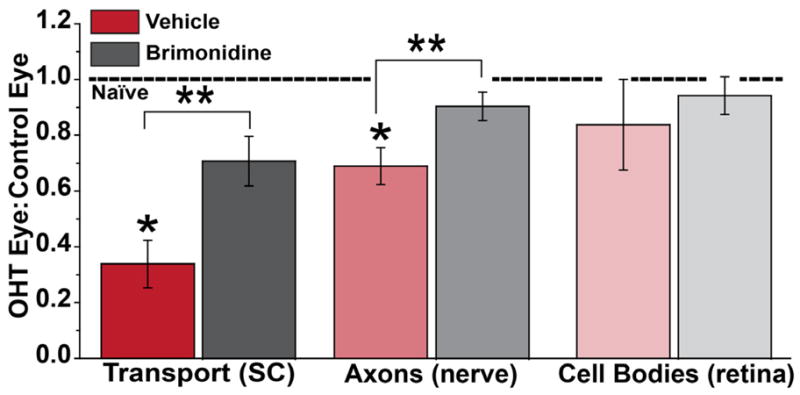
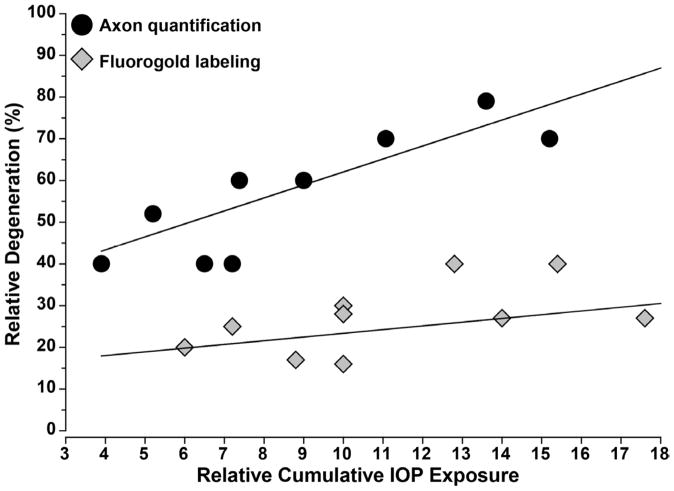
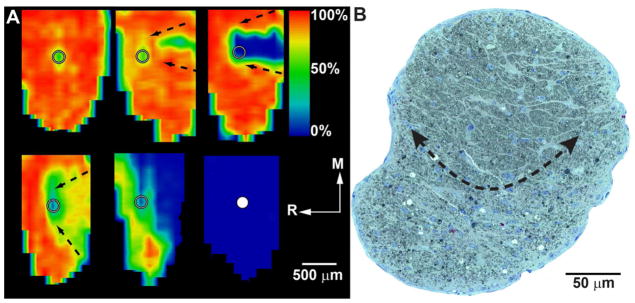
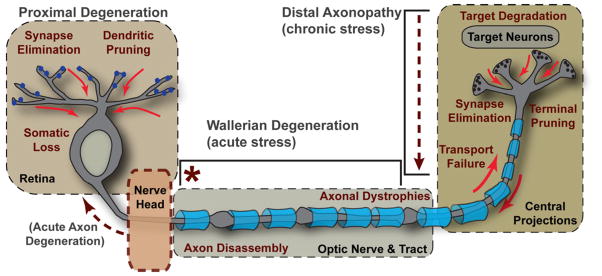
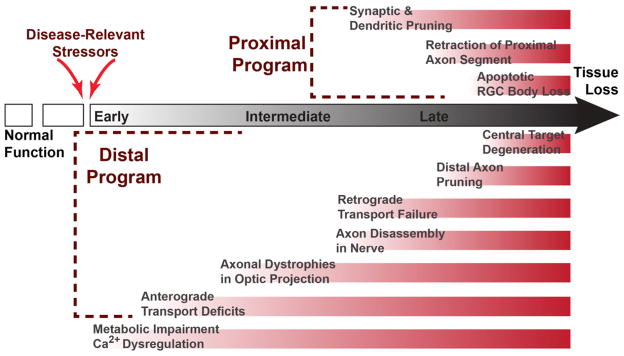
Glaucoma is a common optic neuropathy with a complex etiology often linked to sensitivity to intraocular pressure. Though the precise mechanisms that mediate or transduce this sensitivity are not clear, the axon of the retinal ganglion cell appears to be vulnerable to disease-relevant stressors early in progression. One reason may be because the axon is generally thin for both its unmyelinated and myelinated segment and much longer than the thicker unmyelinated axons of other excitatory retinal neurons. This difference may predispose the axon to metabolic and oxidative injury, especially at distal sites where pre-synaptic terminals form connections in the brain. This idea is consistent with observations of early loss of anterograde transport at central targets and other signs of distal axonopathy that accompany physiological indicators of progression. Outright degeneration of the optic projection ensues after a critical period and, at least in animal models, is highly sensitive to cumulative exposure to elevated pressure in the eye. Stress emanating from the optic nerve head can induce not only distal axonopathy with aspects of dying back neuropathy, but also Wallerian degeneration of the optic nerve and tract and a proximal program involving synaptic and dendritic pruning in the retina. Balance between progressive and acute mechanisms likely varies with the level of stress placed on the unmyelinated axon as it traverses the nerve head, with more acute insult pushing the system toward quicker disassembly. A constellation of signaling factors likely contribute to the transduction of stress to the axon, so that degenerative events along the length of the optic projection progress in retinotopic fashion. This pattern leads to well-defined sectors of functional depletion, even at distal-most sites in the pathway. While ganglion cell somatic drop-out is later in progression, some evidence suggests that synaptic and dendritic pruning in the retina may be a more dynamic process. Structural persistence both in the retina and in central projection sites offers the possibility that intrinsic self-repair pathways counter pathogenic mechanisms to delay as long as possible outright loss of tissue.


Figures

Figure 1
Figure 1. Retinal Projection in the Mammalian Brain
Schematic of contralateral optic projection, which dominates in rodents. The axons of retinal ganglion cells (RGCs) exit the retina through the optic nerve head to form the nerve proper. The nerves from the two eyes meet at the optic chiasm, which parses axons to either the ipsilateral or contralateral optic tract in the brain. Central targets for RGC axons include the suprachiasmatic nucleus (SCN) of the hypothalamus (HT) and several subcortical midbrain nuclei lying distal to it. These include the olivary pretectal nucleus (OPN), the nucleus of the optic tract (NOT), and the posterior pretectal (PPT) nucleus. In primates, the lateral geniculate nucleus (LGN) of the thalamus is the dominant RGC relay to the primary visual cortex, while in rodents the more distal superior colliculus of the midbrain dominates with a smaller LGN projection to the cortex.
Figure 2
Figure 2. Fundamental Retinal Circuitry
Basic retinal circuit includes three classes of excitatory (glutamatergic) neurons: rod and cone photoreceptors, bipolar cells, and retinal ganglion cells (RGCs). Synaptic transmission between photoreceptors and bipolar cells is modulated by inhibitory (GABAergic) horizontal cells in the outer plexiform layer (OPL). Amacrine cells (mostly GABAergic and glycinergic) modulate transmission between bipolar cells and RGCs in the inner plexiform layer (IPL). Müller glia have cell bodies in the inner nuclear layer (INL) along with bipolar, amacrine and horizontal cells and extend processes radially throughout the retina. Astrocyte glia form a dense plexus over RGC axons in the nerve fiber layer (NFL), while microglia distribute broadly. Arrow indicates the path of light. Other abbreviations: RPE (retinal pigment epithelium), ONL (outer nuclear layer), and GCL (ganglion cell layer).
Figure 3
Figure 3. Structure of the Optic Nerve Head
A: Primary zones of the mammalian optic nerve head. Optic disc marks exit of unmyelinated RGC axons from the retina to the prelaminar zone of the nerve head and the conduit for blood vessels (BV). The laminar region (glial lamina in rodents) contains a concentration of astrocytes that separate bundles of axons. The retrolaminar zone marks the transition to oligodendrocyte-derived myelination of axons. B: Immuno-fluorescent confocal micrograph through C57 mouse nerve head labeled for phosphorylated neurofilaments (SMI31) in axons, glial fibrillary acidid protein (GFAP) for astrocytes, and myelin basic protein (MBP). Prelaminar region (PL), glial lamina (GL), transition zone (TZ) and myelinated segment of nerve are indicated. C: optic nerve of squirrel monkey shows well-defined lamina cribrosa (LC) and retrolaminar (RL) region. D: higher magnification of monkey nerve head demonstrates lateral tiling of GFAP-labeled astrocyte processes and fascicles of RGC axons. E: higher magnification of retrolaminar zone in monkey shows transition to myelination. Scale = 50 μm (B, D); 100 μm (C); 20 μm (E).
Figure 4
Figure 4. Distal to Proximal Progression in an Inducible Rat Model
Three degenerative outcomes after 8 weeks of ocular hypertension (OHT) induced unilaterally in rats by laser cauterization of the episcleral veins. With elevated IOP in the OHT eye, anterograde transport to the SC was affected the worst, with a decrease of 70% compared to the SC from the control eye, followed by a 33% loss of axons in the nerve. RGC body loss was sporadic across the retina, with only a 16% decrease averaged across locations. Protection afforded by systemic treatment with brimonidine was proportionally efficacious. Ratio of unity for the two eyes from naïve animals indicated by dotted line. * and ** indicates significance compared to naïve ratio or vehicle treatment, respectively (p ≤ 0.02). Data reproduced from Lambert et al. (2011).
Figure 5
Figure 5. IOP-Induced Loss of Axons is Independent of Method
Graph shows relative degeneration assessed by either quantification of surviving RGC axons in the nerve or of RGC bodies in the retina as a function of cumulative exposure to elevated IOP. Data obtained from three independent rat models of ocular hypertension as summarized in Morrison et al. (2005) and supplemented with additional quantification (Jiang et al., 2007; Doh et al., 2010; Munemasa et al., 2010). Relative cumulative IOP exposure calculated as product of fold-increase in IOP above baseline and period of elevation. Axon loss in the nerve increases linearly with IOP exposure independent of model used (r2 = 0.77, p=0.004). Back-filling of RGCs is less informative, with little dependency on IOP exposure (r2 = 0.04, p=0.59).
Figure 6
Figure 6. Sectorial Progression in the DBA Mouse
A: Retinotopic maps of SC from DBA mice reconstructed from serial coronal sections showing levels of cholera toxin B transported from the retina after intravitreal injection. Degree of intact signal density varies from 100% (red) to 50% (green) to 0% (blue). Maps show the representation of optic disk gap (circle) and sectorial progression of deficits in transport increasing in severity from the caudal edge to the optic disk gap (arrows). Ages are (left to right, top to bottom): 3, 3, 8, 10, 10 and 12 months. R: rostral; M: medial. Maps reproduced from Crish et al. (2010). B: Cross-section through optic nerve of DBA mouse. Arrows outline a sector with advanced progression containing numerous degenerating profiles and extensive gliosis. The unaffected region of the nerve contains fascicles of intact axons separated by astrocyte processes.
Figure 7
Figure 7. Key Events in Progression
The events defining RGC degeneration in glaucoma span four critical regions: retina, optic nerve head, optic nerve and tract, and the central projection to the brain. Disease-relevant stress originating in the nerve head (marked by *) induces a program of distal axonopathy with several characteristics of chronic progression. These include failure of intra-axonal transport and subsequent loss of RGC pre-synaptic active zones and axon terminals in central projection sites, followed by degeneration of target neurons. Pathogenic features follow a distal-to-proximal progression, as in “dying back” neuropathies. In the optic nerve and tract, degeneration of the myelinated RGC axon (indicated by blue oligodendrocyte sheaths) includes features of both distal axonopathy and Wallerian degeneration, including axonal dystrophies and more acute axon disassembly beginning distal to the nerve head. Proximal degeneration is marked by elimination of synapses to RGCs, dendritic pruning and eventual somatic drop-out in the retina. In some models, retraction of the unmyelinated segment from the nerve head could arise from acute axon degeneration (see Coleman, 2005).
Figure 8
Figure 8. Proposed Timeline of Key Events in RGC Degeneration
Normal function in the optic projection is interrupted by disease-relevant stressors, inducing RGC metabolic impairment and dysregulation of intracellular Ca2+. An early consequence is disruption of anterograde axonal transport at distal sites in the optic projection followed by formation of axonal dystrophies. Retrograde transport persists longer in progression and is likely to fail concurrent with axon disassembly. Later in progression, proximal degeneration affects RGC processes in the retina, though the exact timing of synaptic and dendritic pruning is unknown. In this proposed model, the last events are RGC somatic loss proximally and degeneration of neurons in central targets distally, resulting in irreversible tissue loss.

Similar articles

Cited by

References

    1. Allan VJ. Cytoplasmic dynein. Biochem Soc Trans. 2011;39:1169–1178. - PubMed
    1. Almasieh M, Wilson AM, Morquette B, Cueva Vargas JL, Di Polo A. The molecular basis of retinal ganglion cell death in glaucoma. Prog Retin Eye Res. 2012;31:152–181. - PubMed
    1. Ames A., 3rd CNS energy metabolism as related to function. Brain Res Brain Res Rev. 2000;34:42–68. - PubMed
    1. Anderson DR, Hendrickson A. Effect of intraocular pressure on rapid axoplasmic transport in monkey optic nerve. Invest Ophthalmol. 1974;13:771–783. - PubMed
    1. Anderson MG, Smith RS, Hawes NL, Zabaleta A, Chang B, Wiggs JL, John SW. Mutations in genes encoding melanosomal proteins cause pigmentary glaucoma in DBA/2J mice. Nat Genet. 2002;30:81–85. - PubMed

Publication types