. 2012:3:990.
doi: 10.1038/ncomms1999.

Controlled delivery of bioactive molecules into live cells using the bacterial mechanosensitive channel MscL

Affiliations

Controlled delivery of bioactive molecules into live cells using the bacterial mechanosensitive channel MscL

Julia F Doerner et al. Nat Commun. 2012.

Abstract

Bacterial mechanosensitive channels are some of the largest pores in nature. In particular, MscL, with a pore diameter >25 Å, allows passage of large organic ions and small proteins. Functional MscL reconstitution into lipids has been proposed for applications in vesicular-based drug release. Here we show that these channels can be functionally expressed in mammalian cells to afford rapid controlled uptake of membrane-impermeable molecules. We first demonstrate that MscL gating in response to increased membrane tension is preserved in mammalian cell membranes. Molecular delivery is controlled by adopting an established method of MscL charge-induced activation. We then determine pore size limitations using fluorescently labelled model cargoes. Finally, we activate MscL to introduce the cell-impermeable bi-cyclic peptide phalloidin, a specific marker for actin filaments, into cells. We propose that MscL will be a useful tool for gated and controlled delivery of bioactive molecules into cells.


Figures

Figure 1
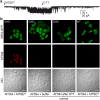
Figure 1. Functional expression of E.coli MscL in mammalian cell lines
(a) Representative currents recorded from excised inside-out patches of vector- (upper panel, n = 7) or MscL- (middle panel) transfected CHO cells in response to 5 s pulses of gradually increasing negative pressure (lower panel) at Vm = -10 mV. (b) Mean pressure threshold (filled symbols) for MscL is comparable in CHO (-92.7 ± 8.6, n = 11) and HEK-293 cells (-88.9 ± 9.5, n = 9). Channels were typically activated when the negative pressure exceeded a threshold in the range of -60 to -120 mm Hg. Note: several individual data points (open symbols) have the same value and thus are hidden. (c) Normalized current-pressure relation recorded from inside-out patches of MscL expressing CHO (n = 8) and HEK-293 cells (n = 5) at Vm = -10 mV. Solid lines represent fits to a Boltzmann equation (CHO, P0.5 = 160.1 ± 9.0; and HEK-293, P0.5 = 147.3 ± 4.3). (d) Representative currents recorded from membrane patches of MscL expressing CHO cells in response to negative pressure (-90 mm Hg) at the indicated voltages. (e) Current-voltage relation of MscL single channel currents. The conductance was calculated from the slope of the linear regression fits (CHO, 2.08 ± 0.03 nS; and HEK-293, 2.15 ± 0.03 nS). (f) Surface staining of live CHO cells expressing FLAG-tagged MscL in a bicistronic IRES-GFP vector. The FLAG-tag staining is limited to GFP-positive (MscL expressing) cells as illustrated by the differential interference contrast (DIC) image. For panels b, c and e, error bars represent SEM. Scale bar, 10 μm.
Figure 2
Figure 2. Functional expression of E.coli MscS in mammalian cell lines
(a) Representative current recorded from excised inside-out patches of MscS- (upper panel) transfected CHO cells in response to 5 s pulses of gradually increasing negative pressure (lower panel) at Vm = -20 mV. (b) Mean activation threshold (filled symbols) for MscS expressed in CHO (-74 ± 4.3, n = 10) and HEK-293 cells (-80 ± 6.2, n = 7). Note: several individual data points (open symbols) have the same value and thus are hidden. (c) Normalized current-pressure relation for MscS expressed in CHO (n = 10) and HEK-293 cells (n = 6) recorded at Vm = -20 mV. Solid lines represent fits to a Boltzmann equation (CHO, P0.5 = 88.8 ± 1.1; and HEK-293, P0.5 = 84.4 ± 1.3). (d) Representative currents recorded from inside-out patches of CHO cells expressing MscS in response to negative pressure at the indicated voltages. (e) Current-voltage relation of MscS single channel currents. The conductance was calculated from the slope of linear regression fits (CHO, inward: 652 ± 25.9 pS and outward: 386 ± 15.1 pS; and HEK-293, inward: 685 ± 18.2 pS and outward: 402 ± 18.9 pS). For panels b, c and e, error bars represent SEM.
Figure 3
Figure 3. Dye delivery through MscL
(a) Outside-out patch recording of MscL G26C. Addition of MTSET (1 mM) to the bath activates MscL G26C while subsequent DTT treatment (1 mM) facilitates channel closure (n = 4, Vm = -20 mV). (b) Dye-delivery into CHO cells expressing MscL G26C treated for 2 min with MTSET (1 mM) in the presence of 5 μM Alexa Fluor 594 and subsequent exposure for 10 min to DTT (1 mM) to mediate channel inactivation (first column). Dye uptake is limited to GFP-positive (MscL expressing) cells as illustrated by the differential interference contrast (DIC) image. No delivery was observed under control conditions: incubation with the dye (Alexa Fluor 594, 5 μM, 2 min) in K-aspartate based delivery solution with no added MTSET (second column); incubation with the dye (Alexa Fluor 594, 5 μM, 2 min) after DTT treatment (1 mM, 10 min) and channel inactivation (third column); in MscL WT expressing CHO cells treated for 2 min with MTSET in the presence of 5 μM Alexa Fluor 594 (fourth column). AF594, Alexa Fluor 594. Scale bars, 20 μm.
Figure 4
Figure 4. Cell viability and integrity after MscL activation by MTSET
(a) Efficient delivery of 10 μM Alexa Fluor 594 into stable CHO-MscL-G26C cells treated for 2 min with MTSET (1 mM) in the presence of the dye (upper row). The control polyclonal CHO-MscL-WT cell line did not take up dye (lower row). AF594, Alexa Fluor 594; DIC, differential interference contrast. Scale bars, 20 μm. (b) Cell-viability as a function of MscL activation time. The monoclonal CHO-MscL-G26C cell line and the polyclonal CHO-MscL-WT cell line (serving as a control) were treated for the indicated time with MTSET (1 mM) followed by DTT exposure (1 mM, 10 min) to facilitate MscL inactivation. To control for nonspecific effects of the delivery solution or the reducing agent, both cell lines were incubated for 20 min in the K-aspartate (K-asp) based delivery solution and for 10 min with DTT (1 mM). Viability was assessed using a MTT assay. Data were collected at 3 independent times in quadruplicate. Error bars represent SEM; P = 0.0094 (CHO-MscL-G26C versus CHO-MscL-WT control after 10 min MTSET treatment) and P < 0.001 (CHO-MscL-G26C versus CHO-MscL-WT control after 20 min MTSET treatment; Student's unpaired t-test)
Figure 5
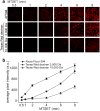
Figure 5. Activation time and molecular weight control delivery efficiency through MscL
(a) Live cell fluorescence imaging of MscL-mediated dye (Alexa Fluor 594, ∼ 760 Da, 20 μM) or dextran-dye conjugate (Texas Red dextran 3,000 and 10,000 Da, 100 μM) delivery using the monoclonal CHO-MscL-G26C cell line. The delivery efficiency increases with increased activation time (incubation with MTSET, 1 mM) and decreases with increased molecule size/molecular weight. Note: 3,000 and 10,000 Da dextran preparations contain branched polymers with molecular weights in the range of 1,500-3,000 and 9,000-11,000 Da, respectively. AF594, Alexa Fluor 594. Scale bars, 20 μm. (b) Average pixel intensity in cells per field (displaying dye or dextran-dye conjugate delivery) as a function of MscL G26C activation time. The mean fluorescent intensity at each time point was calculated for five independent fields. Error bars represent SEM.
Figure 6
Figure 6. MscL mediated delivery of phalloidin
Fluorescence images of CHO-MscL-G26C cells activated for 4 min with MTSET (1 mM) in the presence of 400 nM Alexa Fluor 568 phalloidin (left column) or in control delivery experiments adding phalloidin (4 min) only after inactivation of MscL G26C by DTT (1 mM, 10 min, middle column) or to CHO-MscL-WT cells in the presence of MTSET (4 min, right column). Bright staining of actin filaments was observed after MscL-mediated delivery of phalloidin, but not in control delivery experiments. DIC, differential interference contrast. Scale bars, 20 μm.

Similar articles

Cited by

References

    1. Hamill OP, Martinac B. Molecular basis of mechanotransduction in living cells. Physiol Rev. 2001;81:685–740. - PubMed
    1. Martinac B. Mechanosensitive ion channels: molecules of mechanotransduction. J Cell Sci. 2004;117:2449–2460. - PubMed
    1. Sukharev SI, Blount P, Martinac B, Blattner FR, Kung C. A large-conductance mechanosensitive channel in E.coli encoded by mscL alone. Nature. 1994;368:265–268. - PubMed
    1. Blount P, Schroeder MJ, Kung C. Mutations in a bacterial mechanosensitive channel change the cellular response to osmotic stress. J Biol Chem. 1997;272:32150–32157. - PubMed
    1. Levina N, et al. Protection of Escherichia coli cells against extreme turgor by activation of MscS and MscL mechanosensitive channels: identification of genes required for MscS activity. EMBO J. 1999;18:1730–1737. - PMC - PubMed

Publication types