

Trends in serum lipids among US youths aged 6 to 19 years, 1988-2010
- PMID: 22871871
- PMCID: PMC11292404
- DOI: 10.1001/jama.2012.9136
Trends in serum lipids among US youths aged 6 to 19 years, 1988-2010
Abstract
Context: For more than 20 years, primary prevention of coronary heart disease has included strategies intended to improve overall serum lipid concentrations among youths.
Objective: To examine trends in lipid concentrations among youths from 1988-1994 through 2007-2010.
Design, setting, and participants: Cross-sectional analysis of serum lipid concentrations among 16,116 youths aged 6 to 19 years who participated in the nationally representative National Health and Nutrition Examination Survey during 3 time periods: 1988-1994, 1999-2002, and 2007-2010.
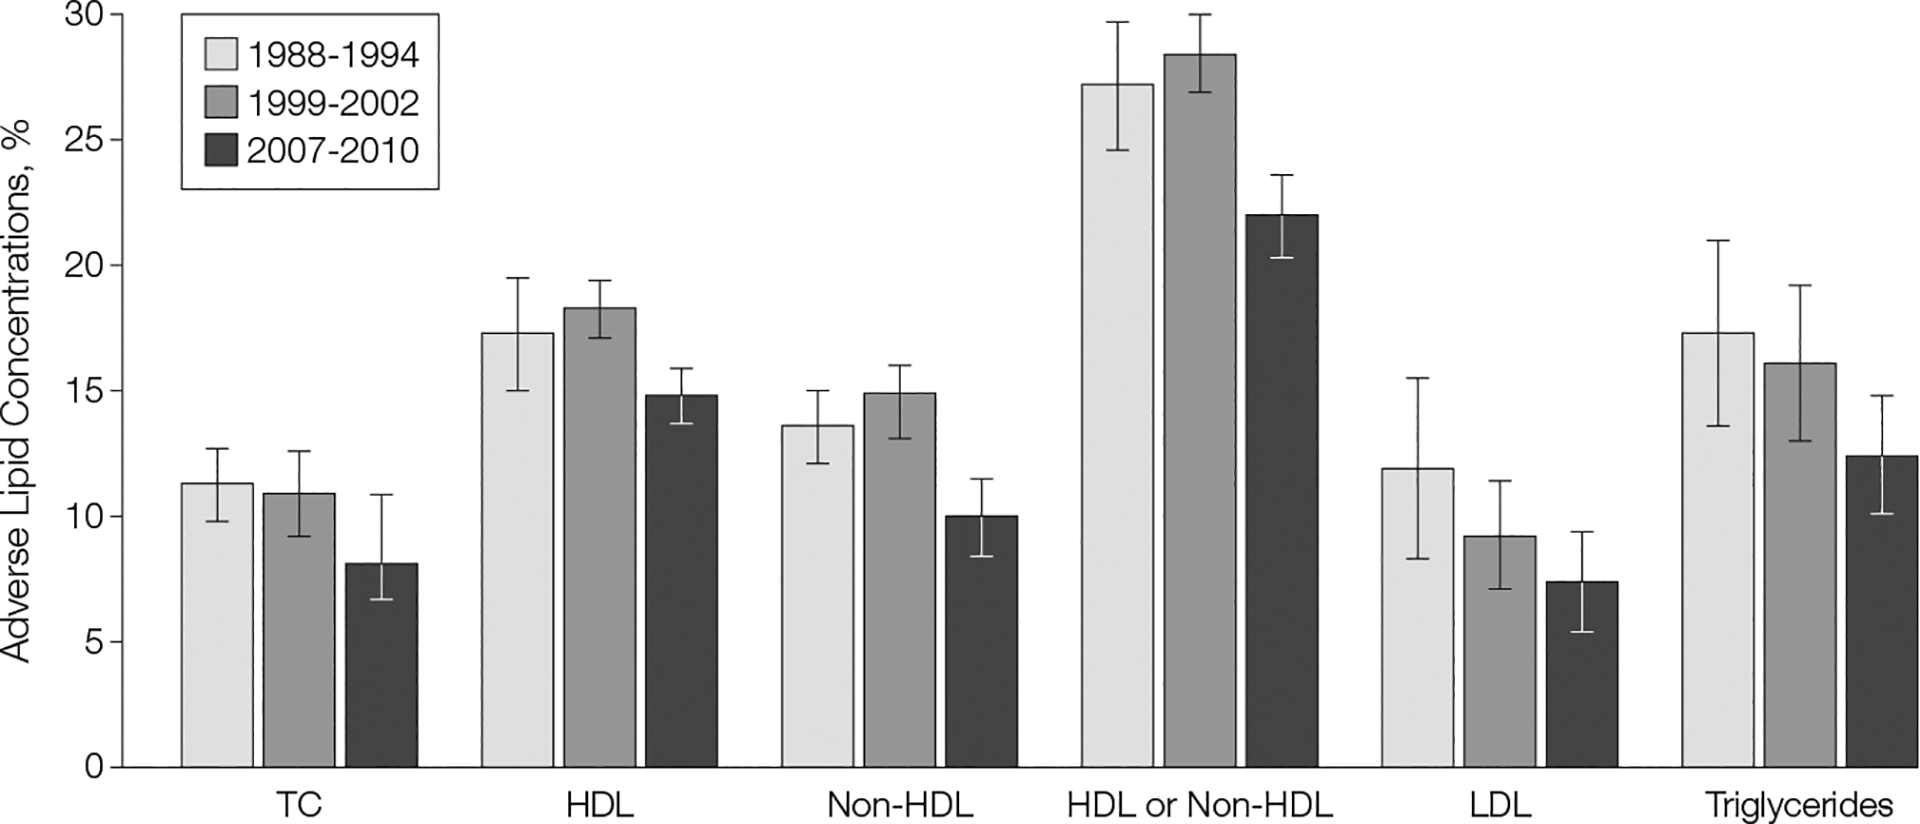
Main outcome measures: Among all youths, mean serum total cholesterol (TC), non-high-density lipoprotein cholesterol (non-HDL-C), high-density lipoprotein cholesterol (HDL-C); and among adolescents only, low-density lipoprotein cholesterol (LDL-C) and geometric mean triglyceride levels. Trends in adverse lipid concentrations are reported for TC levels of 200 mg/dL and greater, non-HDL-C levels of 145 mg/dL and greater, HDL-C levels of less than 40 mg/dL, LDL-C levels of 130 mg/dL and greater, and triglyceride levels of 130 mg/dL and greater.
Results: Among youths aged 6 to 19 years between 1988-1994 and 2007-2010, there was a decrease in mean TC (from 165 mg/dL [95% CI, 164-167] to 160 mg/dL [95% CI, 158-161]; P < .001) and a decrease in the prevalence of elevated TC (from 11.3% [95% CI, 9.8%-12.7%] to 8.1% [95% CI, 6.7%-9.5%]; P = .002). Mean HDL-C significantly increased between 1988-1994 and 2007-2010, but the prevalence of low HDL-C did not change. Mean non-HDL-C and prevalence of elevated non-HDL-C both significantly decreased over the study period. In 2007-2010, 22% (95% CI, 20.3%-23.6%) of youths had either a low HDL-C level or high non-HDL-C, which was lower than the 27.2% (95% CI, 24.6%-29.7%) in 1988-1994 (P = .001). Among adolescents (aged 12-19 years) between 1988-1994 and 2007-2010, there was a decrease in mean LDL-C (from 95 mg/dL [95% CI, 92-98] to 90 mg/dL [95% CI, 88-91]; P = .003) and a decrease in geometric mean triglycerides (from 82 mg/dL [95% CI, 78-86] to 73 mg/dL [95% CI, 70-76]; P < .001). Prevalence of elevated LDL-C and triglycerides between 1988-1994 and 2007-2010 also significantly decreased.
Conclusions: Between 1988-1994 and 2007-2010, a favorable trend in serum lipid concentrations was observed among youths in the United States but almost 1 in 10 had elevated TC in 2007-2010.
Conflict of interest statement
Figures
Comment in
-
Declining cholesterol levels in US youths: a reason for optimism.JAMA. 2012 Aug 8;308(6):621-2. doi: 10.1001/jama.2012.9621. JAMA. 2012. PMID: 22871874 No abstract available.
References
-
- Berenson GS, Srinivasan SR, Bao W, Newman WP III, Tracy RE, Wattigney WA. Association between multiple cardiovascular risk factors and atherosclerosis in children and young adults: the Bogalusa Heart Study. N Engl J Med. 1998;338(23):1650–1656. - PubMed
-
- Li S, Chen W, Srinivasan SR, et al. Childhood cardiovascular risk factors and carotid vascular changes in adulthood: the Bogalusa Heart Study. JAMA. 2003; 290(17):2271–2276. - PubMed
-
- Raitakari OT, Juonala M, Kähönen M, et al. Cardiovascular risk factors in childhood and carotid artery intima-media thickness in adulthood: the Cardiovascular Risk in Young Finns Study. JAMA. 2003; 290(17):2277–2283. - PubMed
-
- Relationship of atherosclerosis in young men to serum lipoprotein cholesterol concentrations and smoking: a preliminary report from the Pathobiological Determinants of Atherosclerosis in Youth (PDAY) Research Group. JAMA. 1990;264(23):3018–3024. - PubMed
-
- Frontini MG, Srinivasan SR, Xu J, Tang R, Bond MG, Berenson GS. Usefulness of childhood non–high-density lipoprotein cholesterol levels versus other lipoprotein measures in predicting adult subclinical atherosclerosis: the Bogalusa Heart Study. Pediatrics. 2008; 121(5):924–929. - PubMed
Publication types
MeSH terms
Substances
Grants and funding
LinkOut - more resources
Full Text Sources
