. 2012 Dec;130(2):391-404.
doi: 10.1093/toxsci/kfs241. Epub 2012 Aug 7.

Neonatal exposure to the cyanobacterial toxin BMAA induces changes in protein expression and neurodegeneration in adult hippocampus

Affiliations

Neonatal exposure to the cyanobacterial toxin BMAA induces changes in protein expression and neurodegeneration in adult hippocampus

Oskar Karlsson et al. Toxicol Sci. 2012 Dec.

Erratum in

  • Toxicol Sci. 2013 Mar;132(1):251

Abstract

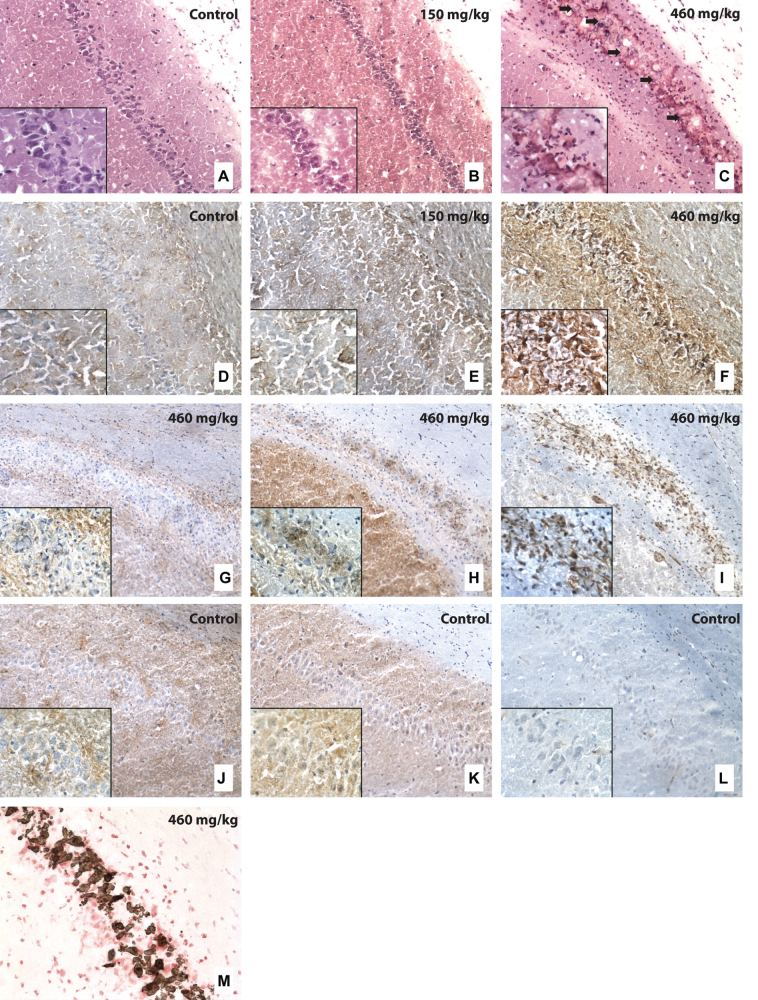
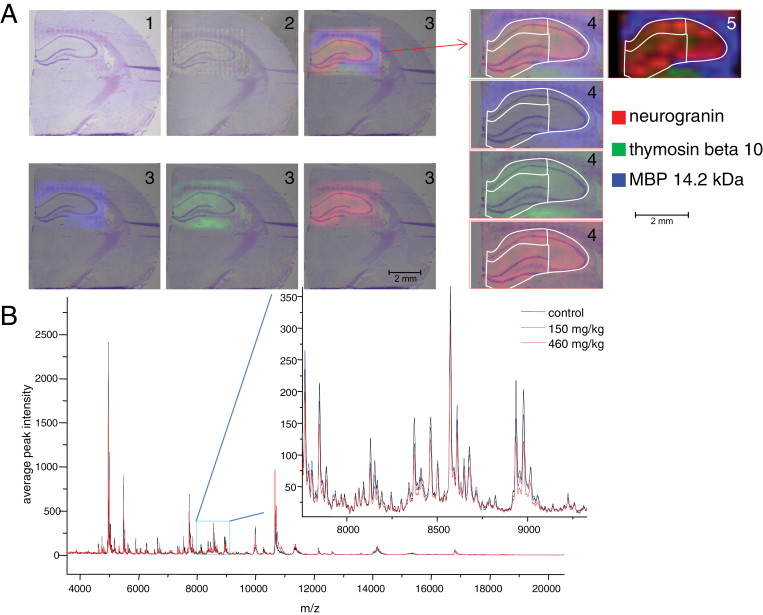
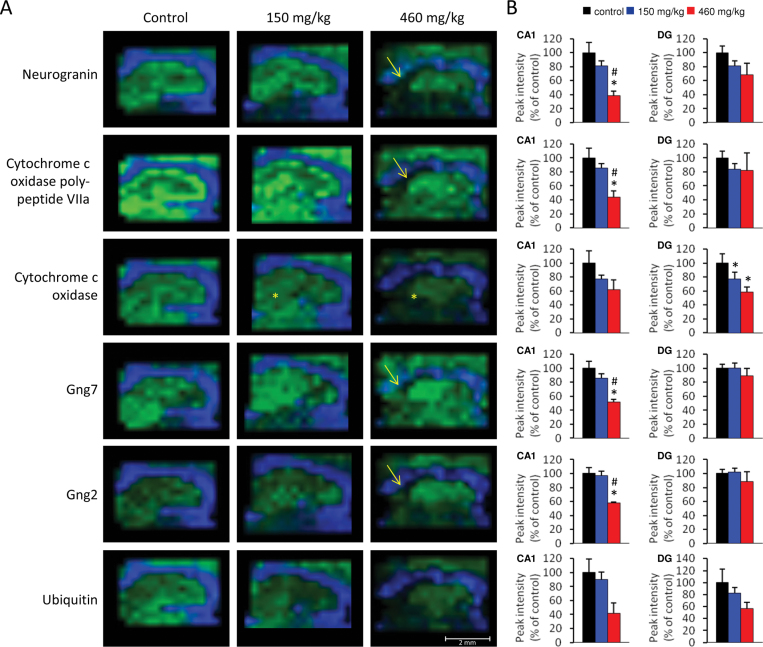
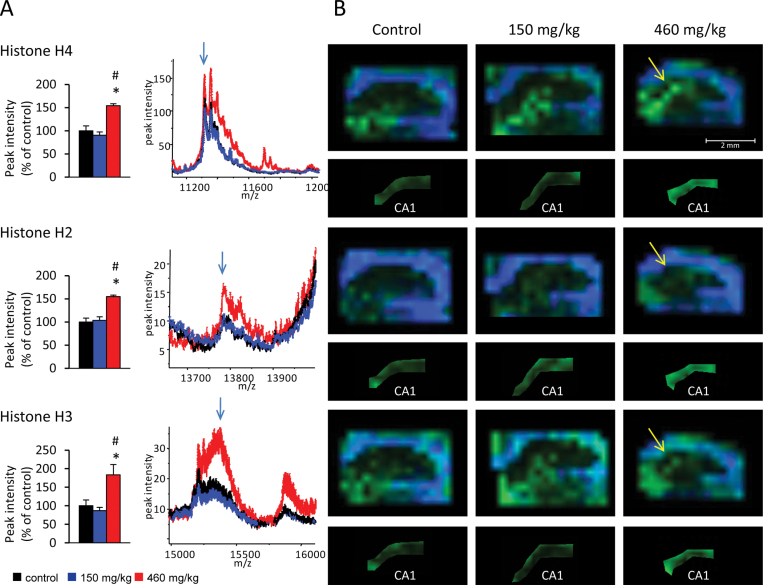
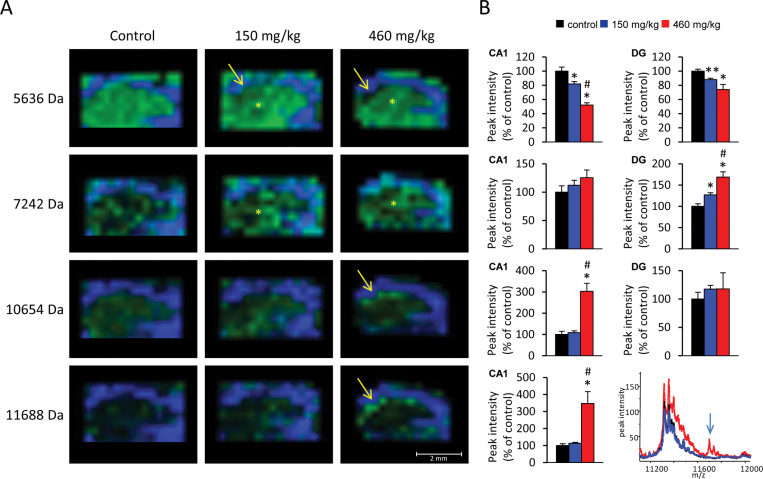
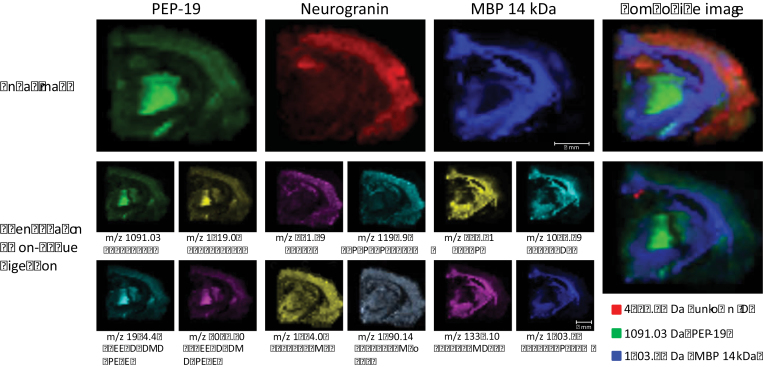
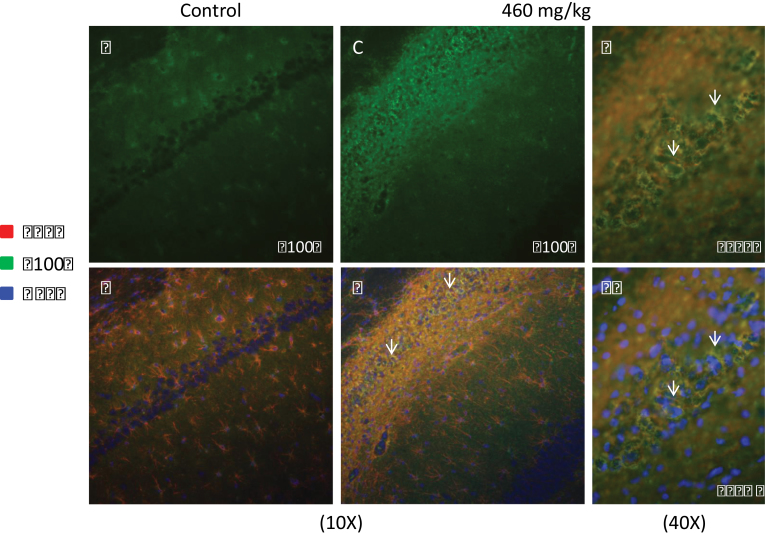
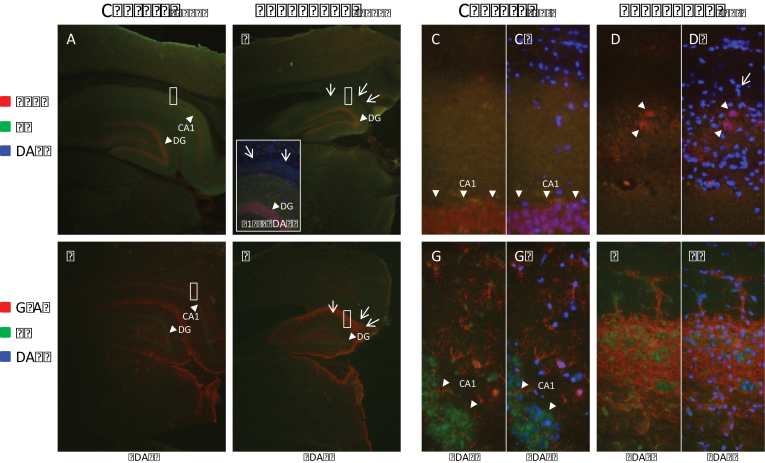
The cyanobacterial toxin β-N-methylamino-L-alanine (BMAA) has been proposed to contribute to neurodegenerative disease. We have previously reported a selective uptake of BMAA in the mouse neonatal hippocampus and that exposure during the neonatal period causes learning and memory impairments in adult rats. The aim of this study was to characterize effects in the brain of 6-month-old rats treated neonatally (postnatal days 9-10) with the glutamatergic BMAA. Protein changes were examined using the novel technique Matrix-Assisted Laser Desorption Ionization (MALDI) imaging mass spectrometry (IMS) for direct imaging of proteins in brain cryosections, and histological changes were examined using immunohistochemistry and histopathology. The results showed long-term changes including a decreased expression of proteins involved in energy metabolism and intracellular signaling in the adult hippocampus at a dose (150 mg/kg) that gave no histopathological lesions in this brain region. Developmental exposure to a higher dose (460 mg/kg) also induced changes in the expression of S100β, histones, calcium- and calmodulin-binding proteins, and guanine nucleotide-binding proteins. At this dose, severe lesions in the adult hippocampus including neuronal degeneration, cell loss, calcium deposits, and astrogliosis were evident. The data demonstrate subtle, sometimes dose-dependent, but permanent effects of a lower neonatal dose of BMAA in the adult hippocampus suggesting that BMAA could potentially disturb many processes during the development. The detection of BMAA in seafood stresses the importance of evaluating the magnitude of human exposure to this neurotoxin.


Figures

FIG. 1.
FIG. 1.
Histological studies on hippocampal sections of adult rats neonatally treated on PND 9–10 with BMAA or vehicle. Upper panel (A–F): H&E staining (A–C) and IHC (D–F) showing the expression of GFAP for detection of reactive astrocytes in the hippocampus (CA1 segment) of rats treated neonatally on PND 9–10 with BMAA or vehicle. The vehicle-treated control rat shows normal cellularity of the CA1 segment of hippocampus (A) and normal GFAP immunoreactivity in the same area (D). The rat treated with 150 mg/kg BMAA (B and E) does not differ from the control rat (A and D). The rat treated with 460 mg/kg BMAA (C) displays marked neuronal cell loss in the CA1 segment, as well as deposition of a birefringent granular material (arrows) both intra-and extracellularly. ˿Strong GFAP immunoreactivity (F), consistent with pronounced astrogliosis, is present in the same region as shown in (C). The insets show details of the CA1 segment. Magnifications: A–F lens ×10; inset in left corner of the images lens ×40. Middle panel (G–L): IHC showing the staining for neurofilament (J and M), α-synuclein (K and N), and ubiquitin (L and O) in the CA1 segment of rats treated neonatally on PND 9–10 with 460 mg/kg BMAA or vehicle. The expression of neurofilament does not differ between a rat treated with BMAA (J) and a vehicle control rat (M). There is a moderately increased expression of α-synuclein in the BMAA-treated rat (K) compared with the control rat (N). Ubiquitin is strongly stained within the CA1 region in the BMAA-treated rat (L), compared with the control rat (O), which shows only faint staining. The insets show details of the CA1 segment. Magnifications: J–O lens ×10; inset in left corner of the images lens ×40. Lower panel (M): von Kossa’s stain demonstrates that the birefringent material observed in the H&E-stained sections consists of calcium deposits (brown). Magnification: lens ×20.
FIG. 2.
FIG. 2.
MALDI IMS of hippocampal sections of adult rats neonatally treated on PND 9–10 with vehicle. (A) Distinct ROI were determined for the entire hippocampus, CA1 and DG of each brain section using both histology and MALDI IMS ion maps. (1) The photomicrograph of the toluidine blue-stained section was co-registered with (2) the image of the spotted section used for MALDI IMS acquisition, here shown at 50% translucency. (3) Multiplexing translucent ion distribution maps of myelin basic protein (MBP) (blue), thymosin β-10 (green), and neurogranin (red) revealed distinct topographical distributions. (4) A composite MALDI IMS shown at 50% translucency and (5) 0% translucency of all three ions at higher magnification demonstrate how the hippocampus was defined dorsally and laterally by white matter fiber tracts (MBP), and ventrally by high thymosin β-10 intensity in the lateral posterior thalamic nucleus. The CA1 ROI only included the medial part of CA1 as defined by the lateral limit of the DG ROI. (B) Average hippocampal mass spectrum from BMAA- and vehicle-treated rats. Over 1000 peaks in the mass range of 3.5–20 kDa were detected and analyzed by MALDI IMS. Most ion intensities displayed a high degree of overlap between the treatment groups, demonstrating good IMS reproducibility (insert).
FIG. 3.
FIG. 3.
MALDI imaging of reduced peak intensities in the hippocampus of adult rats neonatally treated on PND 9–10 with BMAA or vehicle. (A) Six selected proteins are shown: neurogranin, cytochrome c oxidase polypeptide VIIa, cytochrome c oxidase, Gng7, Gng2, and ubiquitin. The regional location of reduced protein expression is indicated by arrows in CA1 and by stars in DG of hippocampus. Proteins of interest are highlighted in green and MBP 14.2kDa (blue) is used to accentuate the dorsal and lateral borders of hippocampus. All proteins were visualized at a fixed absolute intensity threshold. (B) The diagrams show the peak intensity (% of control ± SEM) for the selected proteins in CA1 and DG of hippocampus. Vehicle (black), BMAA 150mg/kg (blue), and BMAA 460mg/kg (red). *p < 0.05 compared with vehicle control animals and #p < 0.05 compared with 150mg/kg (Kruskal-Wallis test and Mann-Whitney’s U-test).
FIG. 4.
FIG. 4.
MALDI ion distribution maps of BMAA-induced up-regulation of histone peak intensities in the CA1 segment of the hippocampus. (A) The diagrams show the peak intensity (% of control ± SEM) for histones H4, H2, and H3 in hippocampus CA1. The corresponding average spectra (± SEM bars) show the protein of interest (arrows) as well as several possible post-translational modifications. Vehicle (black), BMAA 150mg/kg (blue), and BMAA 460mg/kg (red). (B) Three of the animals in the high BMAA-treatment group expressed significantly higher levels of all detected histones in the CA1 (arrows) of hippocampus compared with vehicle controls. The small insertions show only CA1 with the protein of interest displayed at higher color intensity. The data analysis also revealed that many post-translational modifications including possible acetylations (+ 42Da) and phosphorylations (+ 80Da) were significantly higher in animals with CA1 lesions. Proteins of interest are displayed in green. MBP 14.2kDa (blue) was used to accentuate the borders of hippocampus. All proteins were highlighted at a fixed absolute intensity threshold. *p < 0.05 compared with vehicle control animals and #p < 0.05 compared with 150mg/kg (Kruskal-Wallis test and Mann-Whitney’s U-test).
FIG. 5.
FIG. 5.
The MALDI IMS analysis reveals dose-dependent changes in unknown protein levels in the CA1 and DG of adult rats neonatally treated on PND 9–10 with BMAA or vehicle. (A) Examples of protein peaks with unsolved identities that had treatment-related changes of expression in both treatment groups. The ion 5636Da was significantly decreased in both treatment groups in CA1 (arrows) and DG (stars) of hippocampus, and 7242Da is an example of an ion that is increased in DG in both treatment groups. The two ions 10,654 and 11,688Da are examples of protein peaks which were highly increased in CA1 in the three most affected high-dose animals. Proteins of interest were highlighted in green, and MBP 14.2kDa (blue) was used to highlight borders of the hippocampus. All proteins were visualized at a fixed absolute intensity threshold. (B) The diagrams show the peak intensity (% of control ± SEM) for the unidentified masses in hippocampus CA1 and DG. The average spectra (± SEM) from CA1 show that the 11,688Da ion (arrow) as well as several possible post-translational modifications are almost exclusively present in the high-dose group. Vehicle (black), BMAA 150mg/kg (blue), and BMAA 460mg/kg (red). *p < 0.05, **p < 0.01 compared with vehicle control animals, and #p < 0.05 compared with 150mg/kg (Kruskal-Wallis test and Mann-Whitney’s U-test).
FIG. 6.
FIG. 6.
On-tissue tryptic digestion MALDI IMS of hippocampus in a rat neonatally treated on PND 9–10 with BMAA (460mg/kg). The identities of three selected proteins were validated by comparing the distribution of tryptic peptides with the distribution of the intact mass of proteins of interest (upper panel). The upper right composite image shows the localization of all three proteins. The small images (lower panels) show the tryptic peptides generated from the digestion of PEP-19, neurogranin, and MBP 14.2kDa. The lower right composite image shows an unidentified mass 4826.67Da in red that was uniquely detected in the area containing birefringent, granular material in the CA1 of hippocampus.
FIG. 7.
FIG. 7.
Immunofluorescence showing the expression of S100β in the hippocampus (CA1 segment) of rats treated neonatally on PND 9–10 with BMAA (460mg/kg) or vehicle. (A) Low levels of S100β immunofluorescence was detected in normal control animals. (B) Double-antigen IHC for GFAP revealed that S100β was mostly localized to the cytoplasm of astrocytes (yellow signifies overlap). (C–E’) A distinct increase in immunoreactivity was seen in the CA1 segment of a BMAA-treated rat, where S100β immunofluorescence displayed typical circular forms surrounding DAPI-positive nuclei of GFAP-positive astrocytes (D, E, and E’, arrows). Magnifications: A–D lens ×10; E lens ×40.
FIG. 8.
FIG. 8.
Immunofluorescence of brain sections of adult rats neonatally treated on PND 9–10 with BMAA (460mg/kg) or vehicle. (A and B) As second means of validation of MALDI IMS results, double-antigen immunofluorescence for the neuronal nuclear antigen NeuN and cytoplasmic neurogranin (Ng) confirmed loss of Ng immunoreactivity in CA1 in hippocampus of BMAA treated animals (B and insert, arrows) compared with vehicle-treated control (A). (C and D) Higher magnification of the boxed area in A and B revealed that the BMAA-induced loss of NeuN immunoreactive CA1 neurons (arrowheads) was almost complete, whereas the general nuclear staining DAPI highlighted an elevation of the number of non-neuronal cells in the same area (arrow, cf. D’ and C’). (E and F) A high proportion of the non-neuronal cells were identified as astrocytes using an antibody for GFAP. (G and H) Higher magnification of the boxed area in E and F showed that both neurons and astrocytes were histone H4 immunopositive; however, BMAA appears to have caused glial scarring in CA1 and the high number of astrocytes in CA1 may account for the increase in histone H4 peak intensity seen in the MALDI IMS data. Magnifications: left part lens ×2.5; right part lens ×40.

Similar articles

Cited by

References

    1. Aerni H. R., Cornett D. S., Caprioli R. M. (2006). Automated acoustic matrix deposition for MALDI sample preparation. Anal. Chem. 78 827–834 - PubMed
    1. Andersson M., Groseclose M. R., Deutch A. Y., Caprioli R. M. (2008). Imaging mass spectrometry of proteins and peptides: 3D volume reconstruction. Nat. Methods 5 101–108 - PubMed
    1. Banack S. A., Cox P. A. (2003). Biomagnification of cycad neurotoxins in flying foxes: Implications for ALS-PDC in Guam. Neurology 61 387–389 - PubMed
    1. Banack S. A., Johnson H. E., Cheng R., Cox P. A. (2007). Production of the neurotoxin BMAA by a marine cyanobacterium. Mar. Drugs 5 180–196 - PMC - PubMed
    1. Barger S. W., Van Eldik L. J. (1992). S100 beta stimulates calcium fluxes in glial and neuronal cells. J. Biol. Chem. 267 9689–9694 - PubMed

Publication types

MeSH terms