. 2012 Sep;139(17):3157-67.
doi: 10.1242/dev.081174.

Anterior-posterior differences in HoxD chromatin topology in limb development

Affiliations

Anterior-posterior differences in HoxD chromatin topology in limb development

Iain Williamson et al. Development. 2012 Sep.

Abstract

A late phase of HoxD activation is crucial for the patterning and growth of distal structures across the anterior-posterior (A-P) limb axis of mammals. Polycomb complexes and chromatin compaction have been shown to regulate Hox loci along the main body axis in embryonic development, but the extent to which they have a role in limb-specific HoxD expression, an evolutionary adaptation defined by the activity of distal enhancer elements that drive expression of 5' Hoxd genes, has yet to be fully elucidated. We reveal two levels of chromatin topology that differentiate distal limb A-P HoxD activity. Using both immortalised cell lines derived from posterior and anterior regions of distal E10.5 mouse limb buds, and analysis in E10.5 dissected limb buds themselves, we show that there is a loss of polycomb-catalysed H3K27me3 histone modification and a chromatin decompaction over HoxD in the distal posterior limb compared with anterior. Moreover, we show that the global control region (GCR) long-range enhancer spatially colocalises with the 5' HoxD genomic region specifically in the distal posterior limb. This is consistent with the formation of a chromatin loop between 5' HoxD and the GCR regulatory module at the time and place of distal limb bud development when the GCR participates in initiating Hoxd gene quantitative collinearity and Hoxd13 expression. This is the first example of A-P differences in chromatin compaction and chromatin looping in the development of the mammalian secondary body axis (limb).


Figures

Fig. 1.
Fig. 1.
Characterisation of cell lines from distal posterior and anterior mouse forelimb. (A) Schematic of E10.5 forelimb bud showing the dissection into anterior (A) and posterior (P) distal regions. (B) RT-PCR to detect the expression of mesenchymal (Fgf10, Fgf2cR, Etv4) and epithelial (Fgf8, Fgf2cR) markers in immortomouse cell lines derived from the anterior (A) or posterior (P). The two cell line pairs derive from embryos from different litters. Primer sequences are indicated in supplementary material Table S1. –, negative control lacking reverse transcriptase. (C) Log2 A/P expression from microarray analysis of A2/P2 cells for selected genes categorised according to their function.
Fig. 2.
Fig. 2.
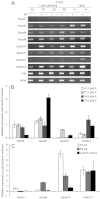
Hoxd expression in distal anterior and posterior limb cell lines and mouse tissue. (A) RT-PCR to detect the expression of 3′ (Hoxd1, Hoxd3, Hoxd4, Hoxd8) and 5′ (Hoxd10, Hoxd11, Hoxd12, Hoxd13) Hoxd genes and the adjacent Lnp in both sets of cell lines (A1/P1, A2/P2) and in E10.5 distal forelimb tissue (A and P). Primer sequences are indicated in supplementary material Table S1. (B,C) Quantitative (q)RT-PCR to compare expression levels of 3′ (Hoxd3, Hoxd8) and 5′ (Hoxd10, Hoxd13) Hoxd genes in both sets of cell lines and in anterior or posterior distal forelimb tissue. (B) Expression in each cell line compared with the corresponding limb tissue. (C) Log2 P/A expression for both sets of cell lines (white and grey bars) and in distal forelimb tissue (black bars).
Fig. 3.
Fig. 3.
H3K27me3 and Ring1B distribution in E10.5 limb cell lines and mouse forelimb tissue. (A) Western blot of H3K27me3 in A2 and P2 cells. Levels of H3 are shown for comparison. (B) Mean log2 H3K27me3/input at HoxD, HoxB, Pax6 and Brd3 loci in A2 and P2 cell lines (top two rows, n=2 biological replicates) and for anterior and posterior forelimb tissue (bottom two rows, n=4 – 2 biological and 2 technical – replicates). (C) As in B, but with an expanded view of the HoxD cluster. (D) Mean log2 Ring1B/input at the HoxD region for anterior and posterior forelimb tissue. n=2 biological replicates. (E) Pie charts showing the genomic distribution of different probes categories enriched for: (top) H3K27me3 in A2 cells (log2 H3K27me3/input≥1) versus (bottom) the proportion with an A2/P2 difference of log2≥1. (F) Mean (± s.e.m.) log2 H3K27me3/input at HoxD and neighbouring genes and promoters in distal forelimb anterior and posterior tissue. Average log2 values were calculated from each individual probe value that covered the genomic locations. The statistical significance of A:P differences in H3K27me3 enrichment over each gene and promoter were examined by two-sample t-test (*P<0.01, **P<0.0001).
Fig. 4.
Fig. 4.
Confirmation of A/P differences in H3K27me3 enrichment. (A) qPCR analysis of ChIP for H3K27me3 at Hoxd1, Hoxd10, Olig2 and Actb (Actin) promoters in A2 (white) and P2 (black) cells. Enrichment is shown as mean percent input bound ± s.e.m. over three biological replicates. (B) As in A, but from E10.5 distal anterior (white) and posterior (black) forelimb tissue. n=2 biological replicates.
Fig. 5.
Fig. 5.
Chromatin decompaction at HoxD in distal posterior limb cells. (A) Schematic of the genomic region around HoxD. The grey boxes above depict the probes used for FISH. Regulatory elements including the GCR and the PROX enhancer are also indicated. (B) 2D FISH with probe pairs at HoxD, the region centromeric to HoxD (GCR-Lnp) and a control region on MMU2, in A1 and P1 nuclei counterstained with DAPI (blue). Scale bars: 5 μm. Probe positions are shown above the images. Box plots show the distribution of interprobe distances (d2) normalised to nuclear radius (r2) for A1 and P1 cells. Shaded boxes show the median and interquartile range of data; crosses indicate outliers. n=∼400 for HoxD, n=∼300 for GCR, n=∼300 for control. The statistical significance of differences were examined by Mann-Whitney U-tests (supplementary material Table S4).
Fig. 6.
Fig. 6.
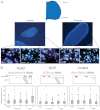
Decompaction of HoxD specific to the distal posterior region of E11 mouse forelimbs. (A) FISH on anterior and posterior tissue sections. Schematic above indicates the position and plane of the sections. Below are examples of nuclei from each of the limb regions and the adjacent flank, hybridised with HoxD probe pairs. Scale bars: 5 μm. (B) Box plots show the distribution of interprobe distances (d2) at the HoxD, GCR and control loci for the proximal and distal anterior and posterior forelimb bud and the adjacent flank. n=100 for HoxD, n>80 for GCR, n>80 for control. Probe positions as indicated in Fig. 5A. Statistical analysis is shown in supplementary material Table S5.
Fig. 7.
Fig. 7.
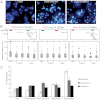
GCR–5′ HoxD colocalisation at the E11 distal posterior mouse forelimb bud. (A) Nuclei from distal limb and flank tissue sections after FISH with GCR and 5′ HoxD probe pairs. Scale bars: 5 μm. (B) FISH with probe pairs: GCR–5′ HoxD, GCR–island III and 5′ HoxD–island III at distal and proximal forelimb bud and flank regions. n≥100 for each. Distribution of interprobe distances as in Fig. 6B and statistical analysis shown in supplementary material Table S7. (C) Percentage colocalised probe pairs (d<200 nm) for each of the genomic regions assayed in the distal anterior, distal posterior, proximal anterior, proximal posterior forelimb bud and the flank. n=100. Error bars indicate s.e.m. obtained from two different tissue sections. The statistical significance of the differences in colocalisation between the limb regions and the flank were examined by Fisher’s exact test (supplementary material Table S8).

References

    1. Amano T., Sagai T., Tanabe H., Mizushina Y., Nakazawa H., Shiroishi T. (2009). Chromosomal dynamics at the Shh locus: limb bud-specific differential regulation of competence and active transcription. Dev. Cell 16, 47–57 - PubMed
    1. Benjamini Y., Hochberg Y. (1995). Controlling the false discovery rate: a practical and powerful approach to multiple testing. J. Roy. Statist. Soc. B 57, 289–300
    1. Boyer L. A., Plath K., Zeitlinger J., Brambrink T., Medeiros L. A., Lee T. I., Levine S. S., Wernig M., Tajonar A., Ray M. K., et al. (2006). Polycomb complexes repress developmental regulators in murine embryonic stem cells. Nat. Cell Biol. 441, 349–353 - PubMed
    1. Chambeyron S., Bickmore W. A. (2004). Chromatin decondensation and nuclear reorganization of the HoxB locus upon induction of transcription. Genes Dev. 18, 1119–1130 - PMC - PubMed
    1. Chambeyron S., Da, Silva N. R., Lawson K. A., Bickmore W. A. (2005). Nuclear re-organisation of the Hoxb complex during mouse embryonic development. Development 132, 2215–2223 - PubMed

Publication types

MeSH terms