Comparative Study
. 2012 Sep;139(17):3248-56.
doi: 10.1242/dev.082016.

A novel 3D mouse embryo atlas based on micro-CT

Affiliations
Comparative Study

A novel 3D mouse embryo atlas based on micro-CT

Michael D Wong et al. Development. 2012 Sep.

Abstract

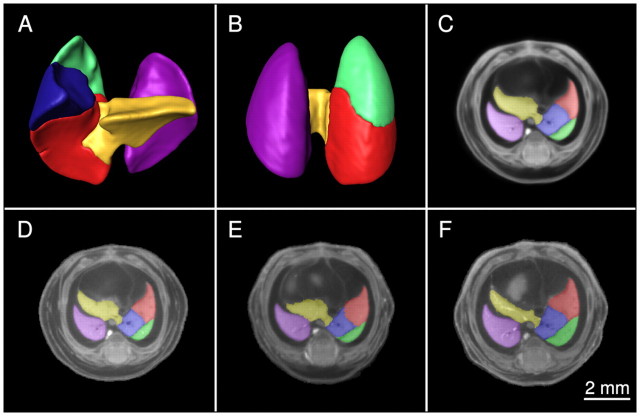
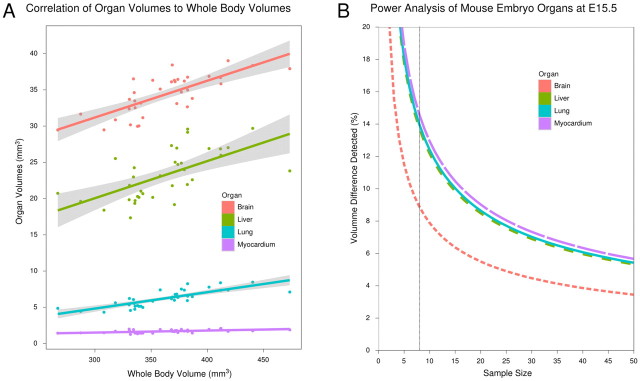
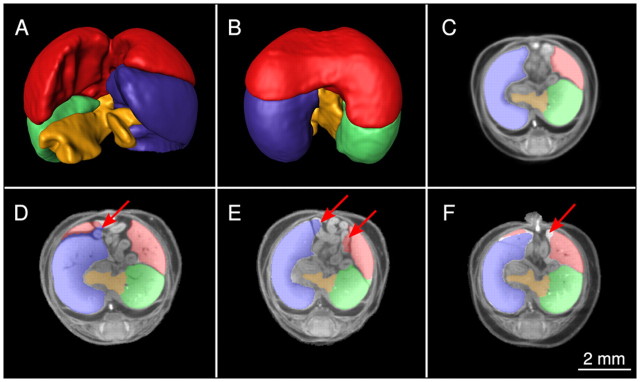
The goal of the International Mouse Phenotyping Consortium (IMPC) is to phenotype targeted knockout mouse strains throughout the whole mouse genome (23,000 genes) by 2021. A significant percentage of the generated mice will be embryonic lethal; therefore, phenotyping methods tuned to the mouse embryo are needed. Methods that are robust, quantitative, automated and high-throughput are attractive owing to the numbers of mice involved. Three-dimensional (3D) imaging is a useful method for characterizing morphological phenotypes. However, tools to automatically quantify morphological information of mouse embryos from 3D imaging have not been fully developed. We present a representative mouse embryo average 3D atlas comprising micro-CT images of 35 individual C57BL/6J mouse embryos at 15.5 days post-coitum. The 35 micro-CT images were registered into a consensus average image with our automated image registration software and 48 anatomical structures were segmented manually. We report the mean and variation in volumes for each of the 48 segmented structures. Mouse organ volumes vary by 2.6-4.2% on a linear scale when normalized to whole body volume. A power analysis of the volume data reports that a 9-14% volume difference can be detected between two classes of mice with sample sizes of eight. This resource will be crucial in establishing baseline anatomical phenotypic measurements for the assessment of mutant mouse phenotypes, as any future mutant embryo image can be registered to the atlas and subsequent organ volumes calculated automatically.


Figures

Fig. 1.
Fig. 1.
Three-dimensional volume rendering of an individual E15.5 mouse embryo image acquired by micro-CT. One of the benefits of 3D digital data is the ability to section the dataset using software in any desired orientation. Sectioning the 3D volume digitally eliminates the restriction of acquiring a 2D section in only one orientation, especially when using a destructive imaging assay like histology. The image is presented at an isotropic voxel size of 28 μm3.
Fig. 2.
Fig. 2.
Input and output images of the image registration of 35 mouse embryo micro-CT images into a consensus average. (A-F) Sagittal (A,D), coronal (B,E) and axial (C,F) sections through a single mouse embryo image before image registration (A-C) and at analogous locations of the average image comprising 35 individual mouse embryo images (D-F). The red cross-hair denotes a homologous point as determined by the registration algorithm in all sections. The average image retains gross structural details and retains organ boundaries from the individual mouse embryo images; however, anatomy that is random in position and size, such as the intestines, is blurred in the registered average image.
Fig. 3.
Fig. 3.
Three-dimensional visualization of the 48 segmented anatomical structures in the E15.5 mouse embryo atlas. A 3D representation of the mouse embryo atlas in which each volume is shown, in different colors, in its native location within the whole mouse embryo volume (semi-transparent). Many of the segmented labels cannot be displayed because they are embedded within other structures, especially in the brain.
Fig. 4.
Fig. 4.
Two-dimensional sections that illustrate details of the mouse embryo atlas. Axial sections of (A) brain, (B) thoracic cavity and (C) abdomen. Also shown are (D,E) two coronal sections and (F) a mid-sagittal section. It is easier to appreciate the detail of this mouse embryo atlas in this fashion as each structure is painted slice by slice, culminating in hundreds of slices in each dimension. Such manual segmentation of a consensus average image would not be possible without successful image registration to produce an average image that is representative of an individual.
Fig. 5.
Fig. 5.
Accuracy of resampling the segmented atlas onto the individual E15.5 mouse embryo images. The accuracy of back-projection onto each single mouse embryo image is illustrated with the five lobes of the lung. (A,B) The left lobe (purple), right cranial lobe (green), right middle lobe (red), right caudal lobe (blue), and right-accessory lobe (gold) labels are shown as 3D volume renderings ventrally (A) and dorsally (B). (C) Its 2D representation superimposed on the average consensus image. (D-F) Three different mouse embryos of the set of 35 from which the average image is composed are shown in an equivalent manner. The colored labels show remarkable correspondence with the underlying structure seen in the grayscale image, giving credence to the image registration algorithm.
Fig. 6.
Fig. 6.
Analysis of intrinsic variation of organ volumes among E15.5 C57BL/6 embryos. (A) Correlation between individual organ volumes and their corresponding whole embryo volumes. A scatter plot of the organ volumes of the brain, liver, lung and myocardium as a function of whole embryo volume. Included is a linear fit and 95% confidence intervals are presented in gray. R2 values for the best-fit linear regression lines are 0.76, 0.52, 0.63 and 0.81 for brain, myocardium, liver and lung, respectively. (B) Power analysis of change in volume as a function of sample size in E15.5 C57BL/6 mouse embryo micro-CT images. The curves are based on a one-sample t-test with P<0.05 and a study power of 0.9. A sample size of eight is sufficient to allow detection of a volume change of 9-14% depending on the organ in question.
Fig. 7.
Fig. 7.
Multiple mouse embryo micro-CT imaging. (A) Dedicated holder to image seven E15.5 mouse embryos at one time. (B) Axial cross-section through the thoracic cavity of seven mouse embryos imaged with micro-CT using the holder presented in A. This is an example of how throughput can be easily increased through simple modification of existing micro-CT systems.
Fig. 8.
Fig. 8.
An example of inaccuracy in image registration in the abdominal cavity of the mature mouse embryo. Variation in intestinal position and size is coupled to liver position in the abdomen, leading to a blurrier average image and an inaccurate calculation of volumes. (A,B) The medial lobe (red), left lobe (blue), right lobe (green) and caudate lobe (gold) are shown as 3D volume renderings ventrally (A) and dorsally (B). (C) Its 2D representation superimposed on the average consensus image. (D-F) Three different mouse embryos of the set of 35 from which the average image is composed are shown in an equivalent manner. The arrows point to sources of volume overestimation (D,E) and underestimation (F) resulting from the less than optimal image registration of the boundaries of the liver.
Fig. 9.
Fig. 9.
Organ morphology is similar regardless of embryo sex apart from the reproductive organs. Axial (top) and coronal (bottom) sections taken from the average image of all 35 mouse embryos, male consensus average and female consensus average image at a level equivalent to the testes (arrows). The superimposed colored labels are from the presented representative atlas. It is visually evident that the labels show good accordance with both male-only and female-only average images, suggesting that tissue morphology is very similar in the two sexes. Testicular volume could be easily identified by registering male-only images into a consensus average.

Similar articles

Cited by

References

    1. Bock N. A., Konyer N. B., Henkelman R. M. (2003). Multiple-mouse MRI. Magn. Reson. Med. 49, 158–167. - PubMed
    1. Cleary J. O., Modat M., Norris F. C., Price A. N., Jayakody S. A., Martinez-Barbera J. P., Greene N. D. E., Hawkes D. J., Ordidge R. J., Scambler P. J., et al. (2011). Magnetic resonance virtual histology for embryos: 3D atlases for automated high-throughput phenotyping. Neuroimage 54, 769–778. - PubMed
    1. Collins D. L., Neelin P., Peters T. M., Evans A. C. (1994). Automatic 3D intersubject registration of MR volumetric data in standardized Talairach space. J. Comput. Assist. Tomogr. 18, 192–205. - PubMed
    1. Copp A. J. (1995). Death before birth: clues from gene knockouts and mutations. Trends Genet. 11, 87–93. - PubMed
    1. de Crespigny A., Bou-Reslan H., Nishimura M. C., Phillips H., Carano R. A. D., D’Arceuil H. E. (2008). 3D micro-CT imaging of the postmortem brain. J. Neurosci. Methods 171, 207–213. - PMC - PubMed

Publication types