

Urinary proteomics for early diagnosis in diabetic nephropathy
- PMID: 22872235
- PMCID: PMC3501878
- DOI: 10.2337/db12-0348
Urinary proteomics for early diagnosis in diabetic nephropathy
Abstract
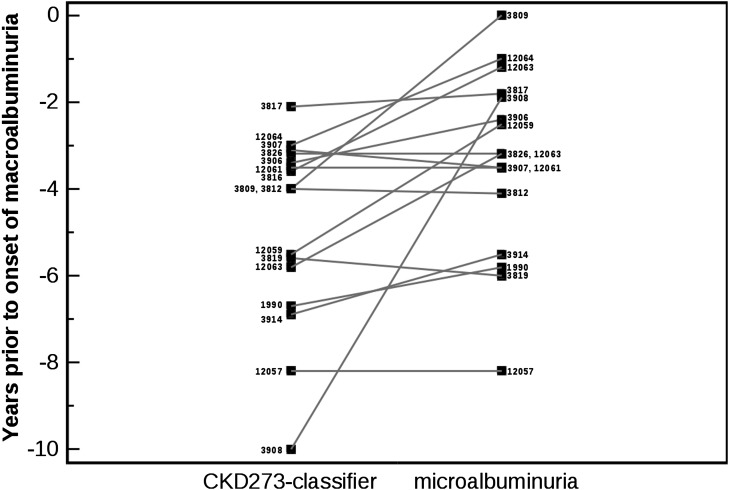
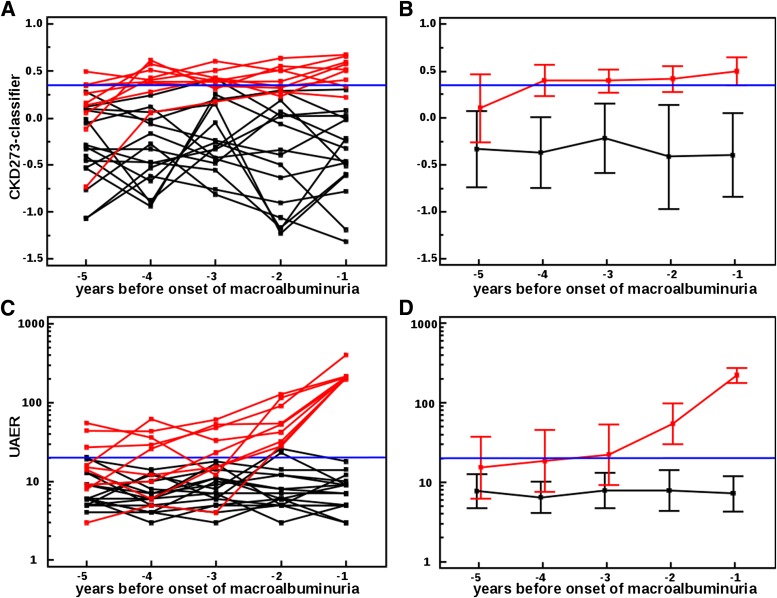
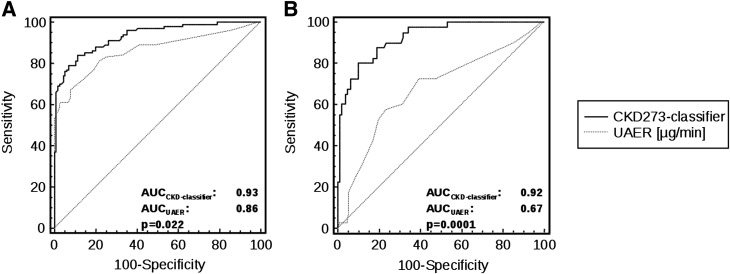
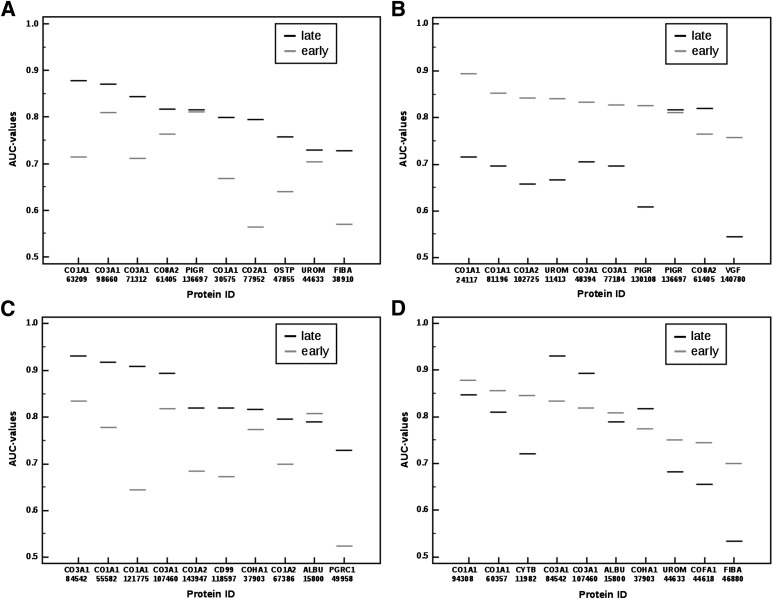
Diabetic nephropathy (DN) is a progressive kidney disease, a well-known complication of long-standing diabetes. DN is the most frequent reason for dialysis in many Western countries. Early detection may enable development of specific drugs and early initiation of therapy, thereby postponing/preventing the need for renal replacement therapy. We evaluated urinary proteome analysis as a tool for prediction of DN. Capillary electrophoresis-coupled mass spectrometry was used to profile the low-molecular weight proteome in urine. We examined urine samples from a longitudinal cohort of type 1 and 2 diabetic patients (n = 35) using a previously generated chronic kidney disease (CKD) biomarker classifier to assess peptides of collected urines for signs of DN. The application of this classifier to samples of normoalbuminuric subjects up to 5 years prior to development of macroalbuminuria enabled early detection of subsequent progression to macroalbuminuria (area under the curve [AUC] 0.93) compared with urinary albumin routinely used to determine the diagnosis (AUC 0.67). Statistical analysis of each urinary CKD biomarker depicted its regulation with respect to diagnosis of DN over time. Collagen fragments were prominent biomarkers 3-5 years before onset of macroalbuminuria. Before albumin excretion starts to increase, there is a decrease in collagen fragments. Urinary proteomics enables noninvasive assessment of DN risk at an early stage via determination of specific collagen fragments.
Figures
Comment in
-
Biomarkers that predict diabetic nephropathy: the long road from finding targets to clinical use.Diabetes. 2012 Dec;61(12):3072-3. doi: 10.2337/db12-1299. Diabetes. 2012. PMID: 23172957 Free PMC article. No abstract available.
References
-
- Alebiosu CO, Ayodele OE. The global burden of chronic kidney disease and the way forward. Ethn Dis 2005;15:418–423 - PubMed
-
- Levey AS, Atkins RC, Coresh J, et al. Chronic kidney disease as a global public health problem: approaches and initiatives - a position statement from Kidney Disease Improving Global Outcomes. Kidney Int 2007;72:247–259 - PubMed
-
- Remuzzi G, Macia M, Ruggenenti P. Prevention and treatment of diabetic renal disease in type 2 diabetes: the BENEDICT study. J Am Soc Nephrol 2006;17(Suppl. 2):S90–S97 - PubMed
-
- Levey AS, Eckardt KU, Tsukamoto Y, et al. Definition and classification of chronic kidney disease: a position statement from Kidney Disease: Improving Global Outcomes (KDIGO). Kidney Int 2005;67:2089–2100 - PubMed
-
- Miller WG, Bruns DE, Hortin GL, et al. National Kidney Disease Education Program-IFCC Working Group on Standardization of Albumin in Urine Current issues in measurement and reporting of urinary albumin excretion. Clin Chem 2009;55:24–38 - PubMed
Publication types
MeSH terms
LinkOut - more resources
Full Text Sources
Other Literature Sources
Medical
